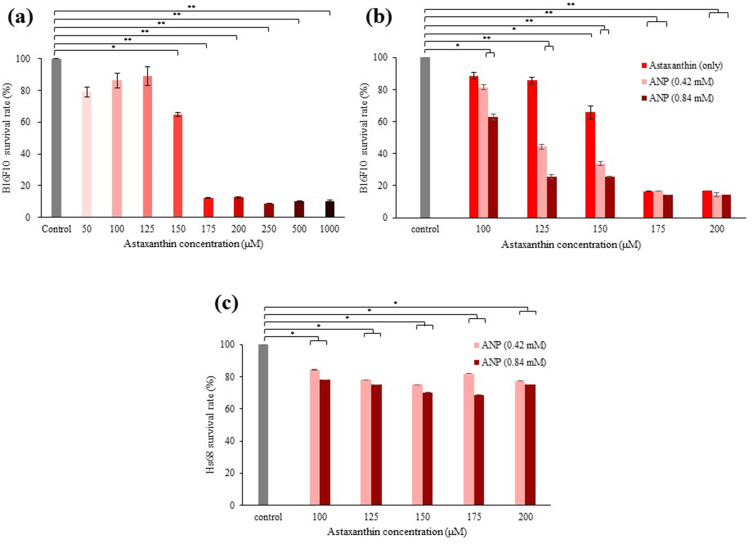
Figure 3.
Cell survival rate. (a) The cell survival rate in B16F10 after conducting different concentrations of uncoated astaxanthin. (b) The cell survival rate in B16F10 after conducting different concentrations of astaxanthin and ANPs (0.42 and 0.84 mM). (c) The cell survival rate in Hs68 after conducting different concentrations of ANPs (0.42 and 0.84 mM). *P < 0.05; **P < 0.01 vs the control group.

