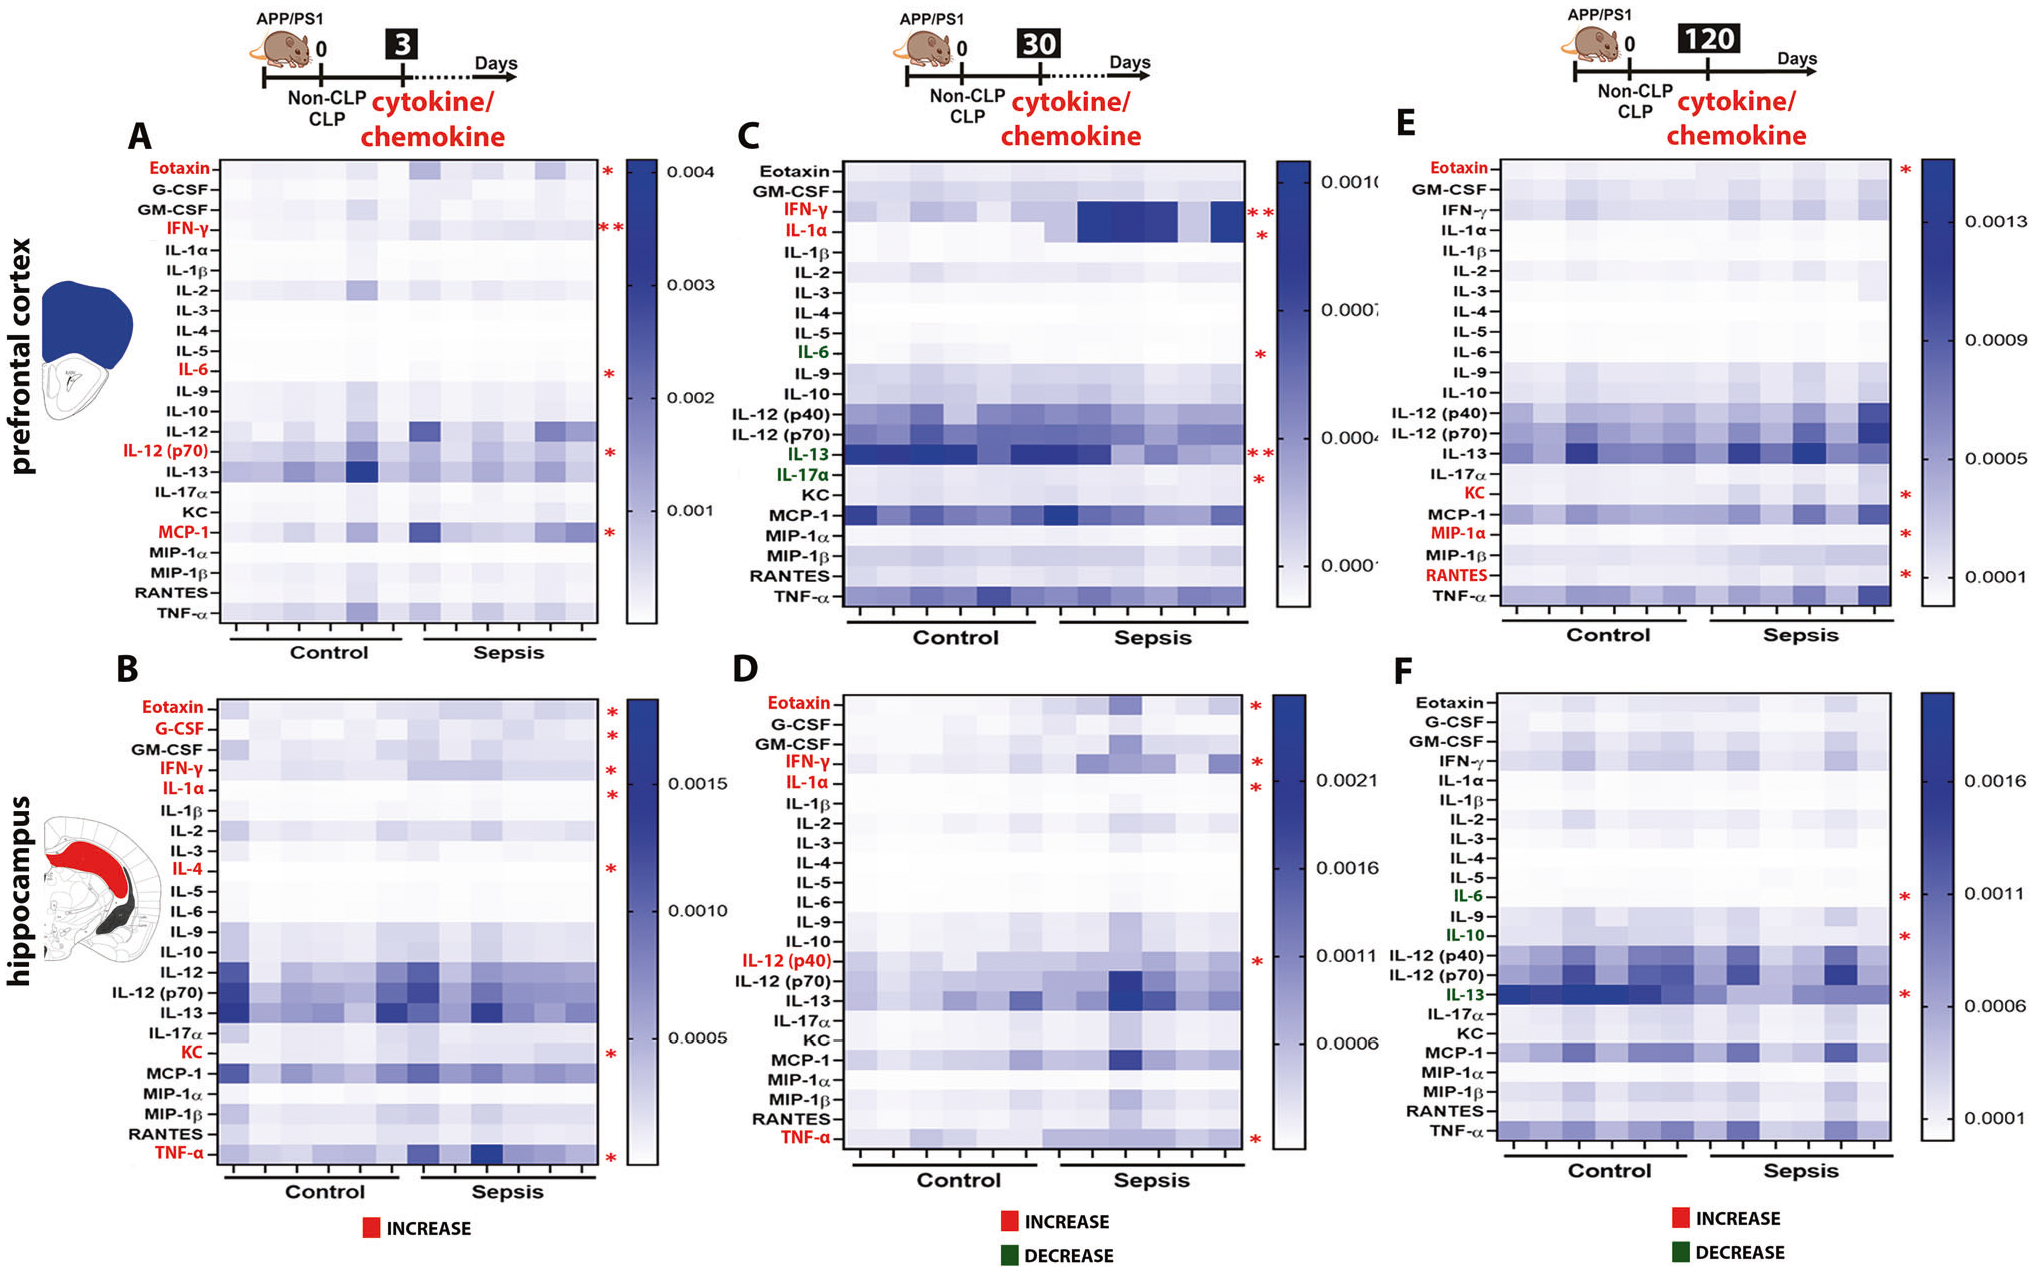
Fig. 4. Assessment of immune activation by measuring the levels of cytokines and chemokines in the APP/PS1 mice brain after CLP challenge.

Evaluation of brain immune modulation at 3, 30, and 120-time points after CLP and non-CLP surgery in PFC and hippocampus using mouse cytokine 23-plex assay. The cytokines and chemokines include interleukin (IL)-1α, IL-1β, IL-2, IL-3, IL-4, IL-5, IL-6, IL-9, IL-10, IL-12 (p40), IL-12 (p70), IL-13, IL-17A, eotaxin, granulocyte colony-stimulating factor (G-CSF), granulocyte-macrophage colony-stimulating factor (GM-CSF), interferon (IFN)-γ, keratinocytes-derived chemokine (KC), monocyte chemoattractant protein (MCP)-1, macrophage inflammatory protein (MIP)-1α, MIP-1β, regulated upon activation, normal T cell expressed and presumably secreted (RANTES), and tumor necrosis factor (TNF)-α, the unit of expression given as pg/μg of protein. A Heatmap of the PFC cytokine/chemokine levels after three days. Sepsis increased the levels of eotaxin, IL-6, IL-12, MCP-1, and IFN-γ in the sepsis group compared to the control. B Heatmap of the hippocampus cytokine/chemokine levels after three days. The sepsis group had elevated levels of eotaxin, G-CSF, IFN-γ, IL-1α, IL-4, KC, and TNF-α compared to the control group. C Heatmap of the PFC cytokine/chemokine levels after 30 days. IFN-γ and IL-1α increased; IL-6 and IL-17α decreased in the sepsis group compared to the control group. D Heatmap of the hippocampus cytokine/chemokine levels after 30 days. Eotaxin, IFN-γ, IL-1α, IL-12, and TNF-α levels increased compared to the control group. E Heatmap of the PFC cytokine/chemokine levels after 120 days. Increased levels of eotaxin, KC, MIP-1 α, and RANTES in the sepsis group compared to the control group. F Heatmap of the hippocampus cytokine/chemokine levels after 120 days. Sepsis decreased IL-6, IL-10, and IL-13 in survivors’ mice. The results are expressed as the mean ± SEM for n = 6. Unpaired Student’s t-tests analyzed the differences between control and sepsis at each time point. *p < 0.05 and **p < 0.01 compared to controls.
