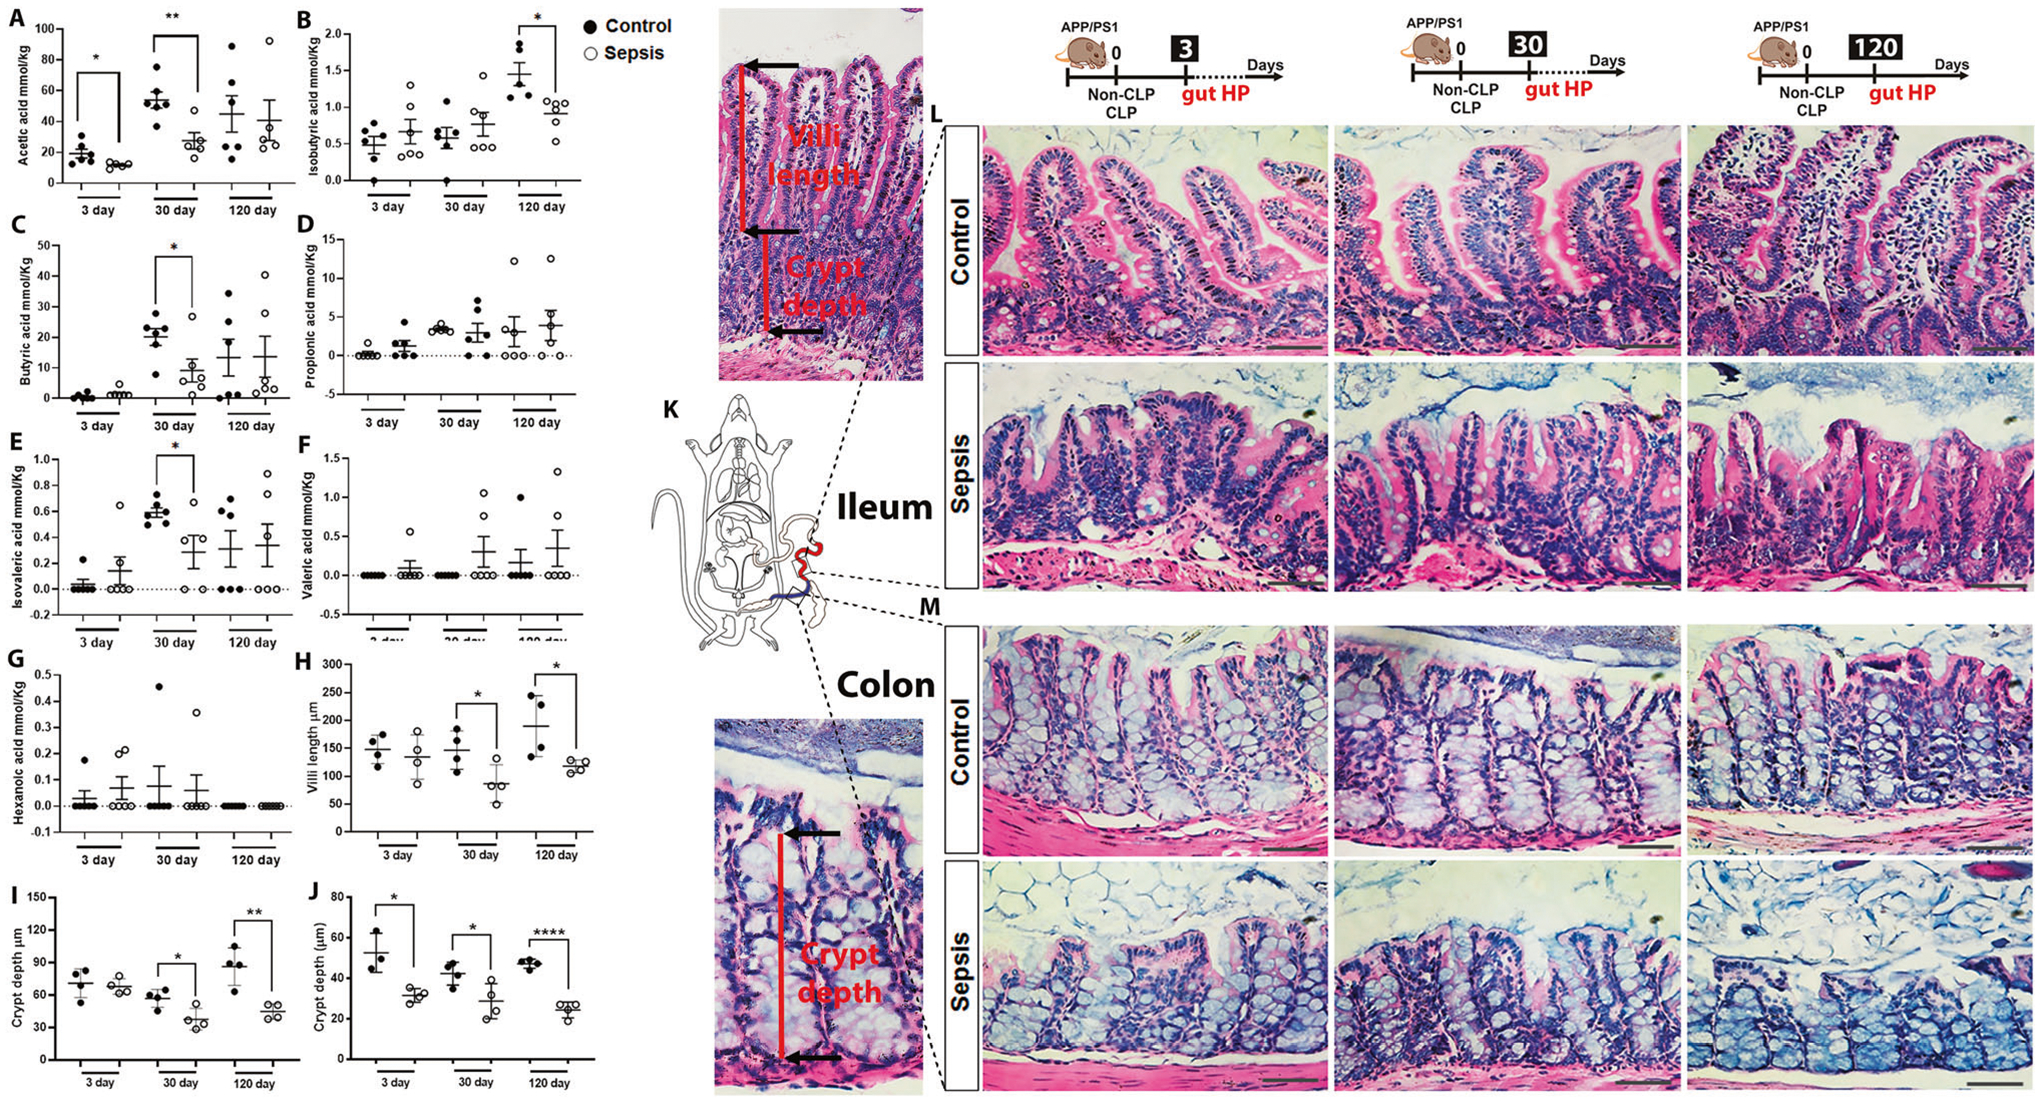
Fig. 6. Cecum feces SCFAs levels and morphometric measurement of intestinal villus length and crypt depth after polymicrobial sepsis in APP/PS1 mice.

Detection of cecum feces SCFAs levels using GC-MS at 3, 30, and 120-time points after CLP and non-CLP surgery in APP/PS1 mice. A Acetic acid. B Isobutyric acid. C Butyric acid. D Propionic acid. E Isovaleric acid. F Valeric acid. G Hexanoic acid. The results are expressed as the mean ± SEM for n = 6. Intestinal architecture in the small intestine and colon was examined after hematoxylin and eosin (H&E) staining at 3, 30, and 120-time points after CLP and non-CLP surgery in APP/PS1 mice. H Ileum villi length at 3, 30, and 120 days after CLP and non-CLP surgery in APP/PS1 mice. I Ileum crypt depth at 3, 30, and days CLP and non-CLP surgery in APP/PS1 mice. J Colon crypt depth 3, 30, and 120 days CLP and non-CLP surgery in APP/PS1 mice. K Schematic representation indicates the ileum and colon region investigated in this experiment. L Representative images of gut ileum at 3, 30, and 120 days after sepsis and control group, magnification ×40. M Representative images of the gut colon at 3, 30, and 120 days in sepsis and control group, magnification ×40. The results are expressed as the mean ± SEM for n = 4. Unpaired Student’s t-tests analyzed the differences between control and sepsis at each time point. Scale bar = 100 μm. *p < 0.05 and **p < 0.01 compared to controls.
