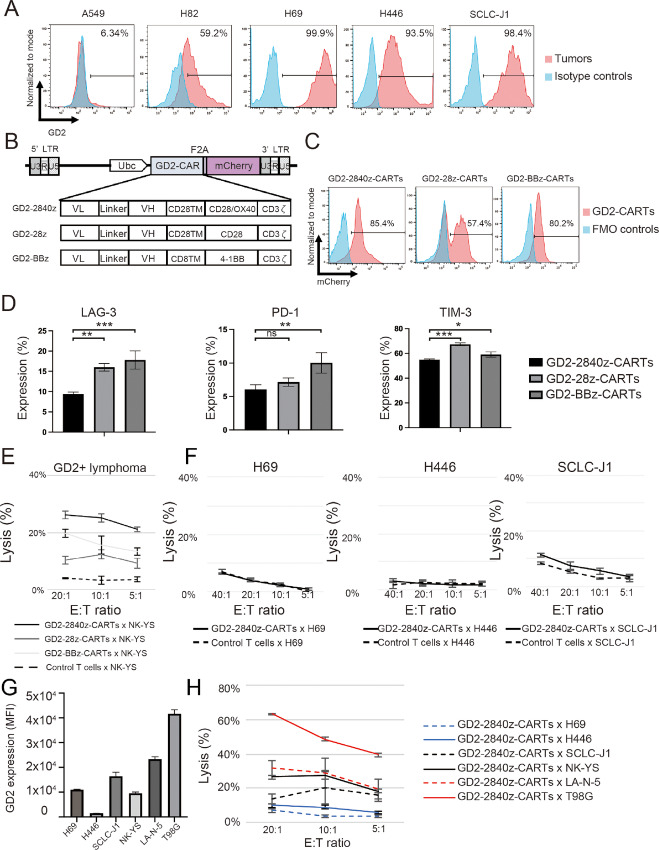
FIGURE 1.
Generation of GD2-CARTs. A, GD2 expression by NSCLC cell line (negative control) and by four SCLC cell lines (red), with isotype control (blue). The plots represent three independent experiments. B, Schema, lentiviral GD2-CAR-vectors containing Ubc promoter. CAR contains an scFv derived from heavy (VH) and light chain (VL) variable regions of 14G2a mAb. TM, transmembrane. Each CAR has a costimulatory domain (highlighted in red): GD2-2840z, CD28 and OX40; GD2-28z, CD28; and GD2-BBz, 4-1BB. The constructs contain the cleavable 2A-like sequence and mCherry. C, Flow cytometric analysis, GD2-CAR transgene expression in GD2-2840z-CARTs, GD2-28z-CARTs, and GD2-BBz-CARTs (red). Fluorescence minus one (FMO) control (blue). The histogram represents three independent experiments. D, Flow cytometric analysis, expression of LAG-3, PD-1, and TIM-3 on day 12 after transduction. Error bars represent ± SD. Data represent triplicate experiments. *, P < 0.05; **, P < 0.01; ***, P < 0.001, respectively by one-way ANOVA. E,In vitro51Cr release assay of GD2-2840z-CARTs, GD2-28z-CARTs, and GD2-BBz-CARTs (effectors) against GD2+ tumor cells (NK-YS). Error bars represent ± SD. Data represent triplicate experiments. F,In vitro51Cr release assay of GD2-2840z-CARTs against GD2+ SCLC. Error bars represent ± SD. Data represent three independent triplicate experiments. G, Flow cytometric analysis, MFI of GD2 on GD2-expressing tumors. Error bars represent ± SD. The bars represent triplicate experiments. H,In vitro51Cr release assay of GD2-2840z-CARTs against SCLC cell lines. Error bars represent ± SD. Data represent triplicate experiments.

