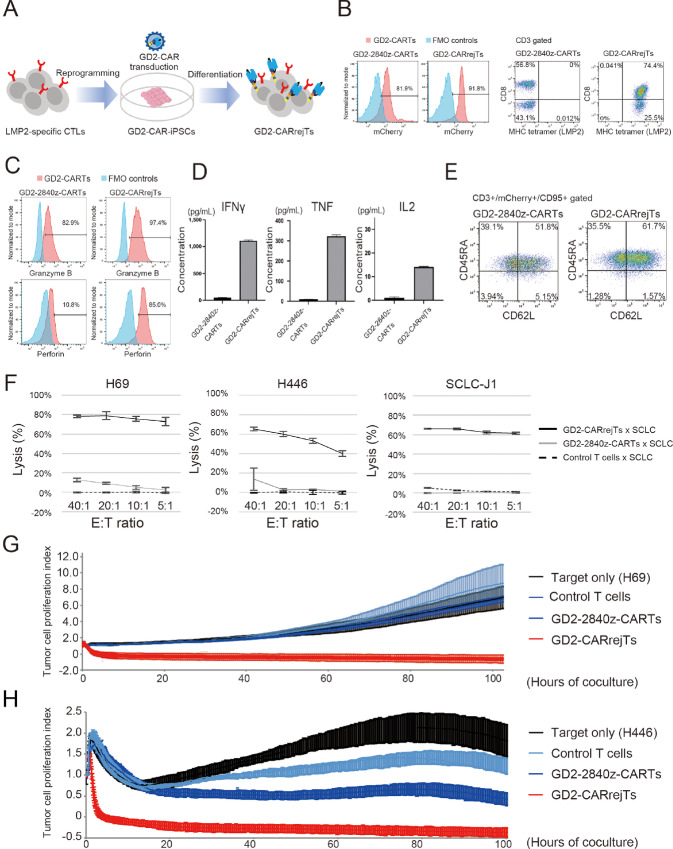
FIGURE 2.
Generation of GD2-CARrejTs. A, Schema, generation of GD2-CARrejTs. T-iPSCs established from LMP2-specific CTL clones were transduced with lentiviral GD2-CAR and GD2-CAR-iPSCs were differentiated into GD2-CARrejTs. B, Flow cytometric analysis of GD2-2840z-CARTs and GD2-CARrejTs to evaluate CAR transgene expression and LMP2 antigen specificity. Histogram in blue, fluorescence minus one (FMO) control. Histogram in red, GD2-2840z-CARTs and GD2-CARrejTs. The plots represent three independent experiments. C, Intracellular perforin and granzyme B marking, GD2-2840z-CARTs and GD2-CARrejTs (red). Histogram in blue, FMO control. The plots represent three independent experiments. D, CBA for measuring cytokines (IFNγ, TNF, and IL2) produced by effector T cells (GD2-2840z-CARTs and GD2-CARrejTs) after 24 hours of coculture with SCLC-J1. Error bars represent ± SEM. E, Representative flow cytometrogram of memory phenotype (CD45RA and CD62 L population) among GD2-2840-CARTs and GD2-CARrejTs. F,In vitro51Cr assays of GD2-2840z-CARTs, GD2-CARrejTs, and control T cells against SCLC cell lines. Error bars represent ± SD. Data represent three independent triplicate experiments. G, RTCA continuous graphical output of tumor proliferation indices up to 40 hours for H69 cells cocultured with control T cells, GD2-2840z-CARTs, and GD2-CARrejTs and for tumor only; E:T ratio uniformly 1:1. Data were plotted and are shown as mean ±SD. Data represent three independent triplicate experiments. H, RTCA continuous graphical output of tumor proliferation indices up to 100 hours for H446 cells cocultured with control T cells, GD2-2840z-CARTs, and GD2-CARrejTs and for tumor only; E:T ratio uniformly 1:1. Data were plotted and are shown as mean ±SD. Data represent three independent triplicate experiments.

