FIGURE 3.
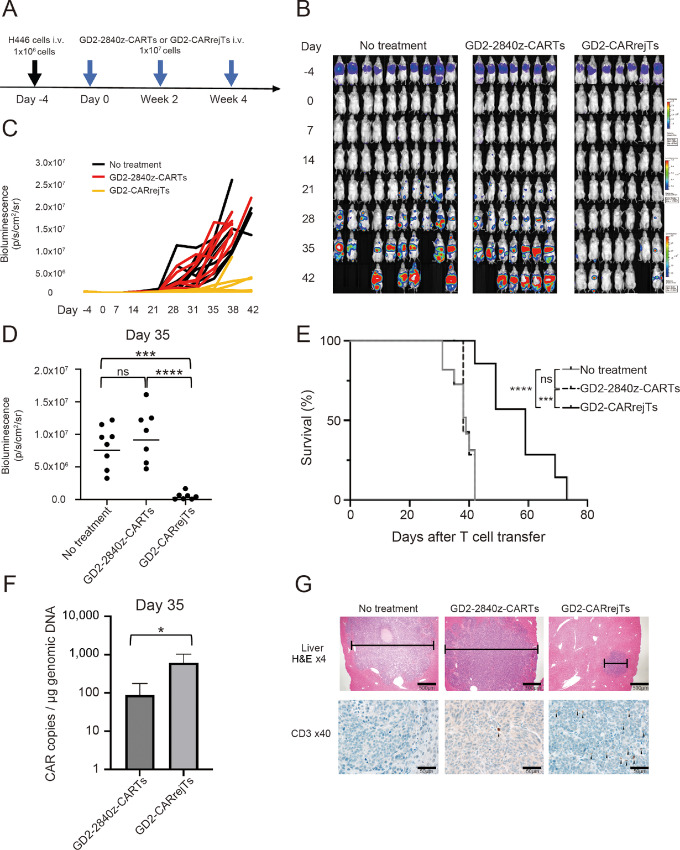
Robust tumor suppressive effect of GD2-CARrejTs in vivo.A, Graphical abstract of in vivo experiment. H446 cells labeled with FFluc/GFP were intravenously injected into NOG mice (1 × 10⁶ cells/mouse) 4 days before treatment. Mice treated with GD2-2840z-CARTs and GD2-CARrejTs were treated every 2 weeks (three doses). B, Bioluminescence imaging of mice engrafted with H446 cells in three groups: no treatment group (control group, n = 10), GD2-2840z-CARTs group (n = 7), and GD2-CARrejTs group (n = 7). Images of all mice from each group of three independent experiments are shown. C, Tumor burden of each mouse is shown, comparing the in vivo efficacy of GD2-2840z-CARTs and GD2-CARrejTs. Bioluminescence kinetics of all mice from each group of three independent experiments are shown: no treatment group (control group, n = 10), GD2-2840z-CARTs group (n = 7), and GD2-CARrejTs group (n = 7). D, Quantitation of tumor burden on day 35 is shown: no treatment group (n = 8), GD2-2840z-CARTs group (n = 7), and GD2-CARrejTs group (n = 7). ****, P < 0.0001 by one-way ANOVA. E, Kaplan–Meier curves representing percentage survival of groups: no treatment group (n = 10), GD2-2840z-CARTs group (n = 7), and GD2-CARrejTs group (n = 7). ***, P < 0.001; ****, P < 0.0001 by log-rank test. ns, not significant. F, Copy numbers of GD2-CAR transduced T cells in mouse treated with GD2-2840z-CARTs and GD2-CARrejTs on day 35. Error bars represent ± SD. The plots represent three independent experiments. G, Photomicrographs, representative hematoxylin and eosin–stained sections of liver of SCLC-bearing mouse in each group; no treatment, GD2-2840z-CART treatment, and GD2-CARrejT treatment (top row). Infiltrates are bracketed. Human CD3+ T-cell infiltrates in liver (bottom row). CD3+ T cells are stained in brown (black arrowhead). 4x, 40x: Objective lens. Scale bars, each 20 µm.

