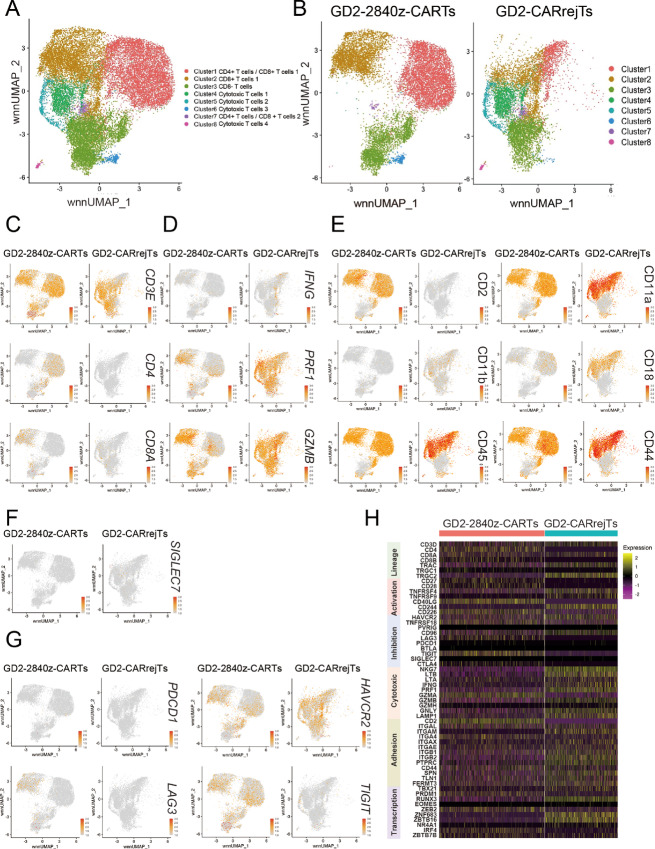
FIGURE 4.
scRNA-seq analysis of GD2-2840-CARTs and GD2-CARrejT. A and B, UMAP projection of scRNA-seq data of GD2-2840z-CARTs and GD2-CARrejTs. Cluster gene characteristics determine cluster functional description. Cluster 1: CD4+ T cells/CD8+ T cells 1; Cluster 2: CD8+ T cells 1; Cluster 3: CD8− T cells; Cluster 4: Cytotoxic T cells 1; Cluster 5: Cytotoxic T cells 2; Cluster 6: Cytotoxic T cells 3; Cluster 7: CD4+ T cells/CD8+ T cells 2; Cluster 8: Cytotoxic T cells 4. Cells colored according to single-cell genotype group. C, Lineage (CD3E, CD4, CD8A). D, Cytotoxicity (IFNG, PRF1, GZMB). E, Immunologic synapse (CD2, CD11a, CD11b, CD45, CD44). F, Inhibitory immunoreceptor (SIGLEC7). G, Exhaustion (HAVCR2, LAG-3, TIGIT, PD-1). H, Heat map of unique signature genes (lineage, costimulation, coinhibition, cytotoxic molecules, transcription factors) for each individual cluster.

