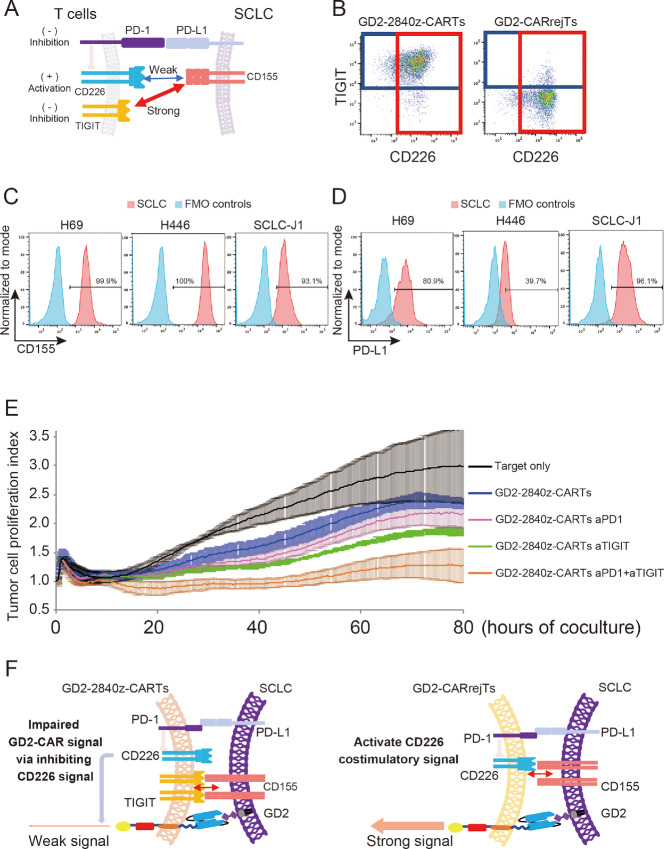
FIGURE 5.
Blockade of TIGIT and PD-1 augments cytotoxicity of GD2 2840z-CARTs. A, Schema of immune-regulatory mechanism of T cells against SCLC. B, Flow cytometric analysis of TIGIT and CD226 expression on GD2-2840z-CARTs and GD2-CARrejTs. The plots represent independent triplicate experiments. C, Flow cytometric analysis of CD155 expression on H69, H446, and SCLC-J1 (red). Histogram in blue, fluorescence minus one (FMO) control. The histograms represent independent triplicate experiments. D, Flow cytometric analysis of PD-L1 expression on GD2-expressing tumor cell lines (H69, H446, and SCLC-J1; red). Histogram in blue, FMO control. The histograms represent independent triplicate experiments. E, RTCA continuous graphical output of tumor proliferation indices up to 80 hours alone and in coculture with GD2-2840z-CARTs with/without anti-TIGIT (aTIGIT) and/or anti-PD-1 antibodies (aPD-1). Data were plotted and are shown as mean ± SD. Data represent three independent triplicate experiments. F, Schema of immune-regulatory mechanism of GD2-2840z-CARTs and GD2-CARrejTs against SCLC.

