
Figure 2.
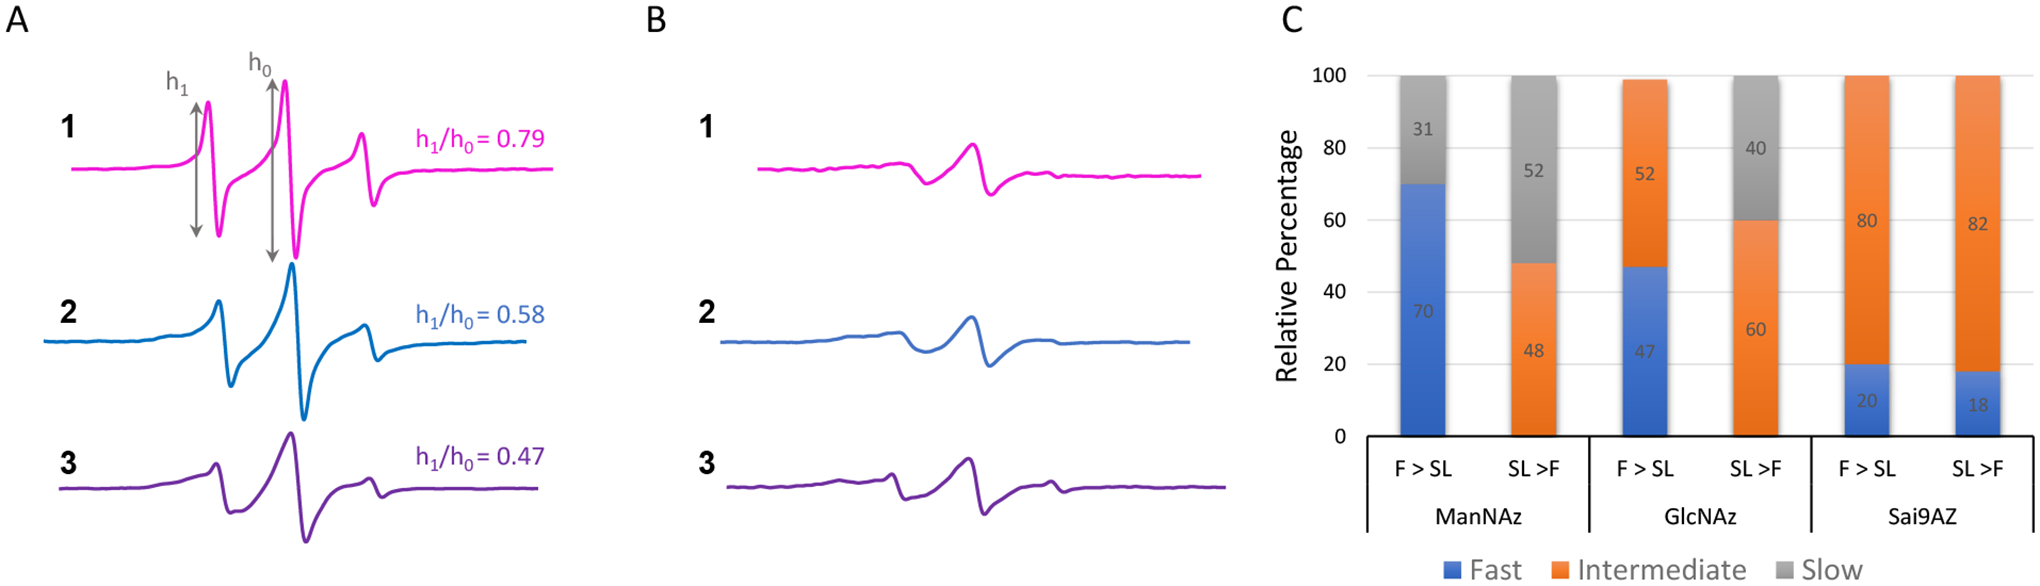
Stack plots of vertically offset 100 G X-band EPR spectra for control-subtracted HeLa cells treated with Ac4ManNAz (1), Ac4GlcNAz (2) or 9-Az-Sialic acid (3) that were (A) fixed with PFA and then reacted with DBCO-SL 4 or (B) reacted with DBCO-SL 4 and then fixed with PFA (dotted lines). Spectra are plotted with normalized integral areas to reflect mobilities. Annotations for the h1 and h0 transition area shown. Values for h1/ho given in the figure are evaluated for spectra from conditions where the cells were fixed and then spin-labeled. (C) Relative results of spectral components from fitting with Easy Spin where τR ≤ 2 ns is designated as “fast”, 2 ns < τR ≤ 10 ns is designated as “intermediate”, and τR > 10 ns is designated as “slow”. Numbers reflect the relative percentages.