
Figure 3.
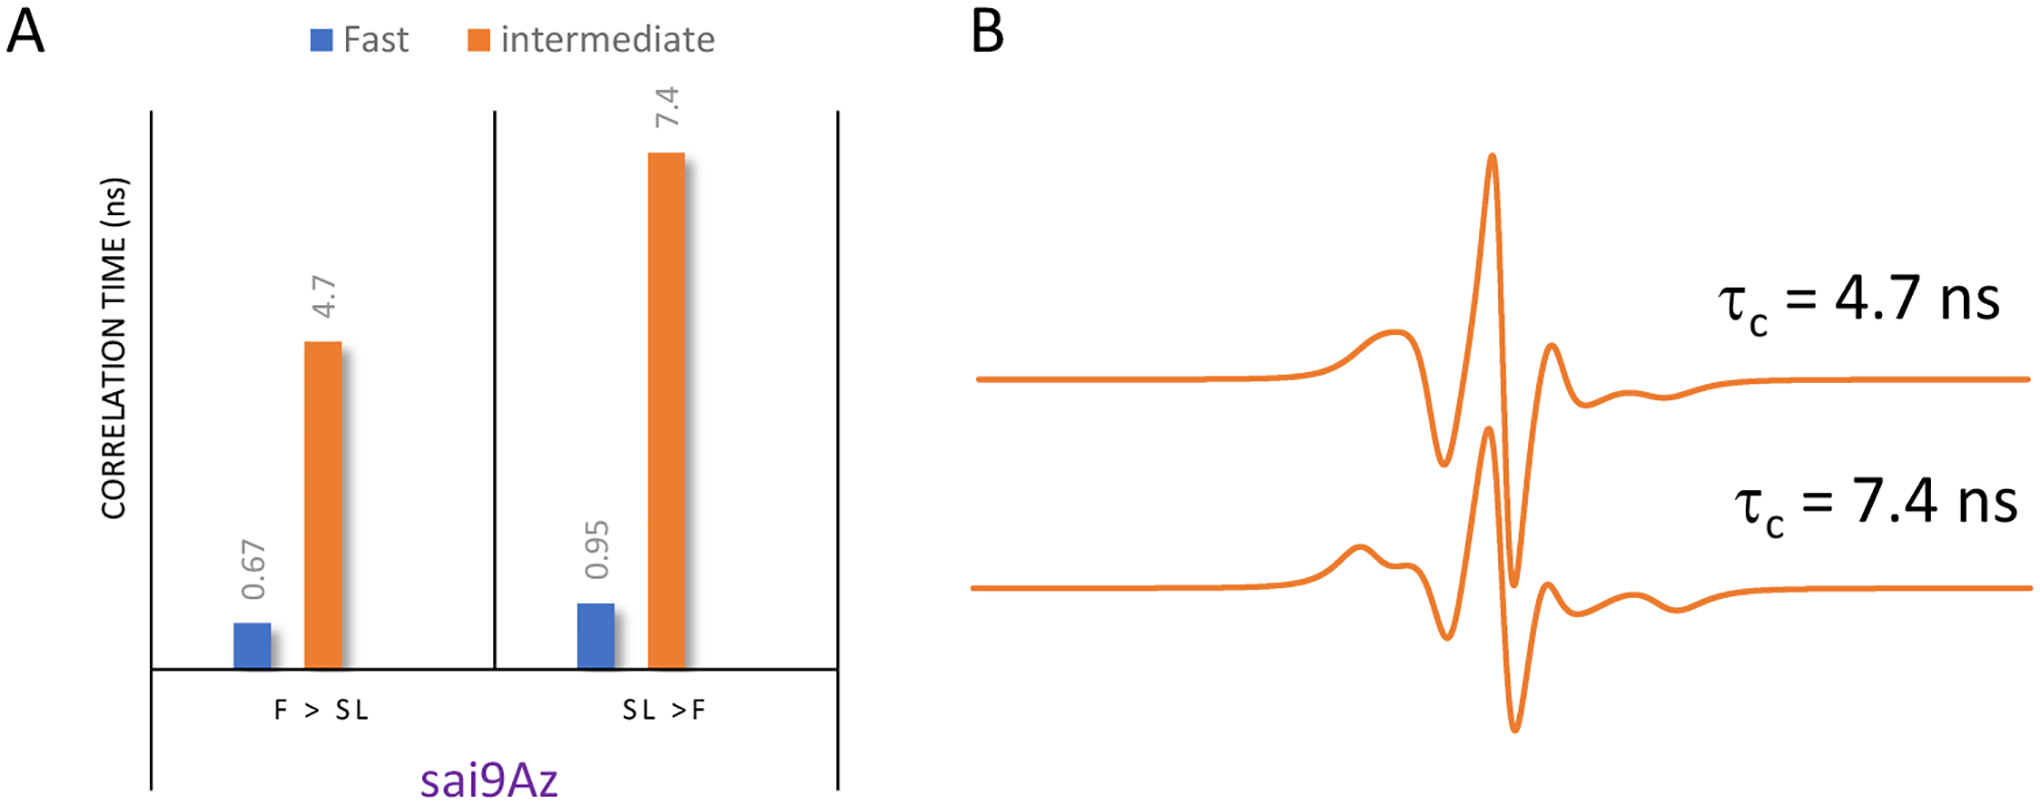
(A) Correlation time analysis from theoretical fitting of MGE of HeLa cells treated with 3 as a function of the order of chemical fixation, with correlation times in units of ns labeled on each bar. (B) X-band intermediate motion EPR component spectra from Easy Spin fitting showing how the EPR lineshape has discernable changes with respect to the intermediate regime correlation times. In both cases the intermediate motional component comprises 80% of the total signal.