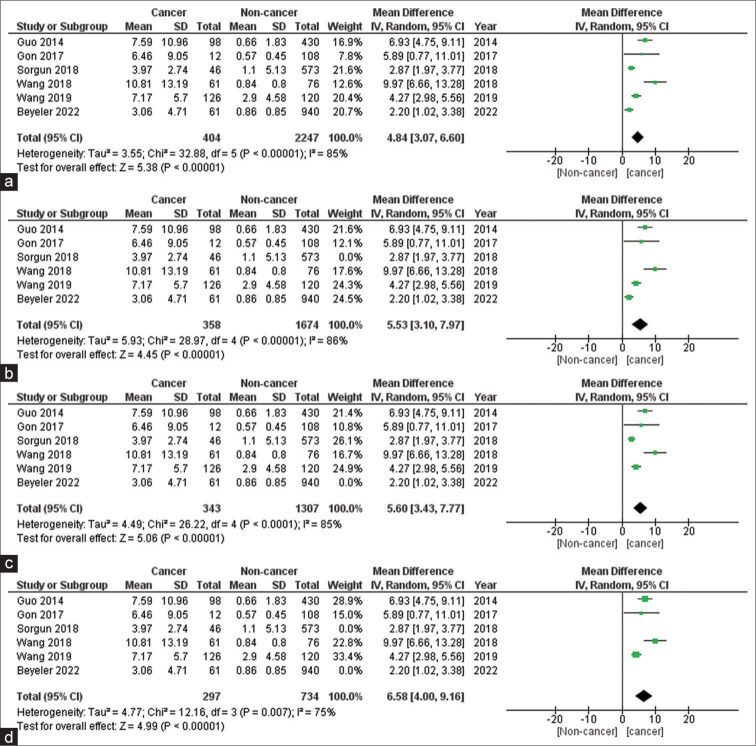
Figure 2:
(a) Forest plot diagram of D-dimer values in cancer and non-cancer group; (b) forest plot diagram of sensitivity analysis by removing study by Sorgun et al.; (c) forest plot diagram of sensitivity analysis by removing study by Beyeler et al.; and (d) forest plot diagram of sensitivity analysis by removing study by Sorgun et al. and Beyeler et al. SD: Standard deviation, CI: Confidence interval.

