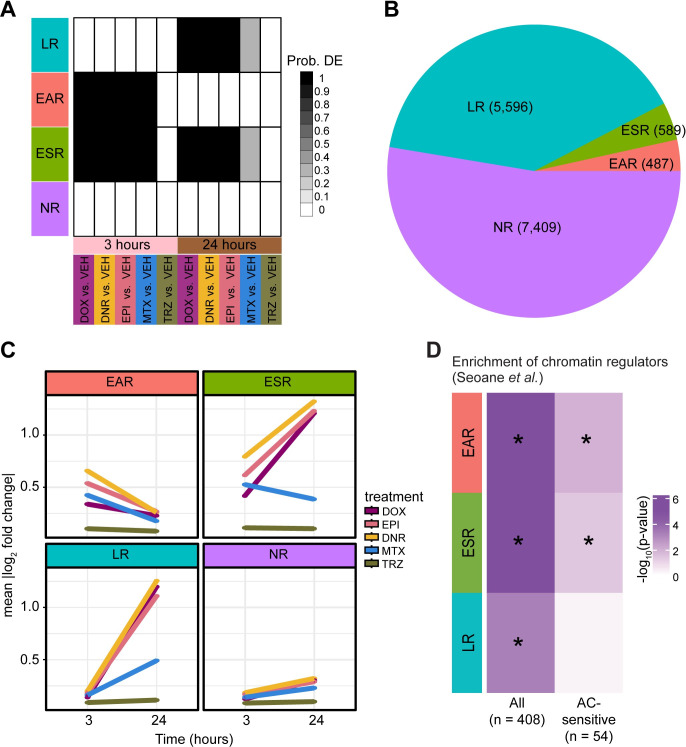
Fig 4. Chromatin regulators that mediate breast cancer sensitivity to ACs are enriched amongst early TOP2i response genes.
(A) Gene expression motifs identified following joint modeling of test pairs. Shades of black represent posterior probabilities of genes being differentially expressed in response to each drug treatment compared to VEH at each time point. Genes are categorized based on their posterior probabilities: genes with a p > 0.5 in only 24 hour TOP2i drug treatments are designated as ‘Late response genes’ (LR: blue), genes with a p > 0.5 in only three hour TOP2i drug treatments are designated as ‘Early-acute response genes’ (EAR: red), genes with a p > 0.5 in the three and 24 hour TOP2i drug treatments are designated as ‘Early-sustained response genes’ (ESR: green), and genes with a p < 0.5 across all tests are designated as ‘Non-response genes’ (NR: purple). (B) The total number of genes that are assigned to each TOP2i response category. (C) The mean absolute log2 fold change of each gene in response to each drug at each timepoint within each TOP2i response category. (D) Enrichment of chromatin regulators amongst TOP2i response gene categories compared to the non-response gene category. A curated list of chromatin regulators (n = 408) and chromatin regulators that are sensitive to ACs in breast cancer patients (n = 54) was obtained from Seoane et al. [22]. Enrichment amongst response categories was calculated by a Chi-square test of proportions. Color represents the -log10 P value for all tests. Significant tests are denoted with an asterisk.

