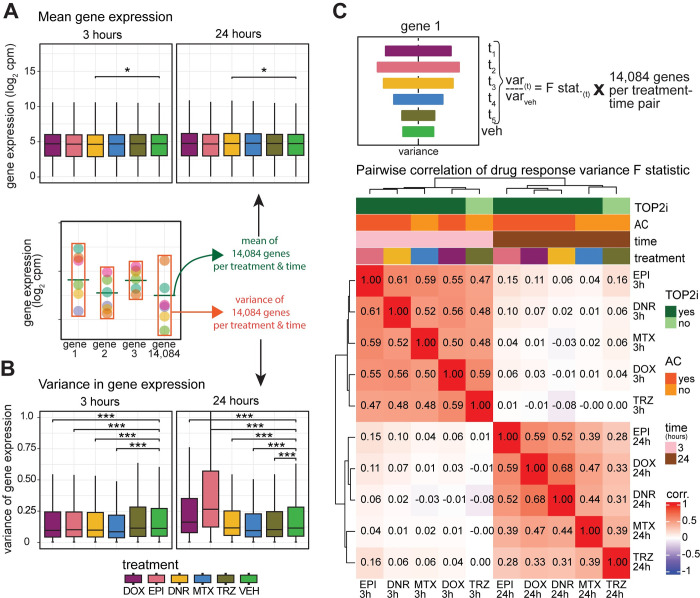
Fig 5. AC treatments induce transcriptional variation across individuals over time.
(A) Mean expression levels of all 14,084 expressed genes across individuals for each drug treatment at each timepoint. (B) Variance of gene expression levels of all 14,084 expressed genes across individuals for each drug treatment at each timepoint. (C) The F-statistic was used to test for differences in the variance between each drug treatment and vehicle for all 14,084 expressed genes at each timepoint. These values were compared across 12 treatment-time groups by hierarchical clustering of the Spearman correlation values. Color intensity indicates the strength of the correlation. Drug responses are colored by whether the drug is a TOP2i (TOP2i: dark green; non-TOP2i: light green), whether the drug is an AC (AC: dark orange; non-AC: light orange), and the exposure time (3 hours: pink; 24 hours: brown). Asterisk represents a statistically significant change between drug treatment and vehicle (*p < 0.05, **p < 0.005, ***p < 0.0005).

