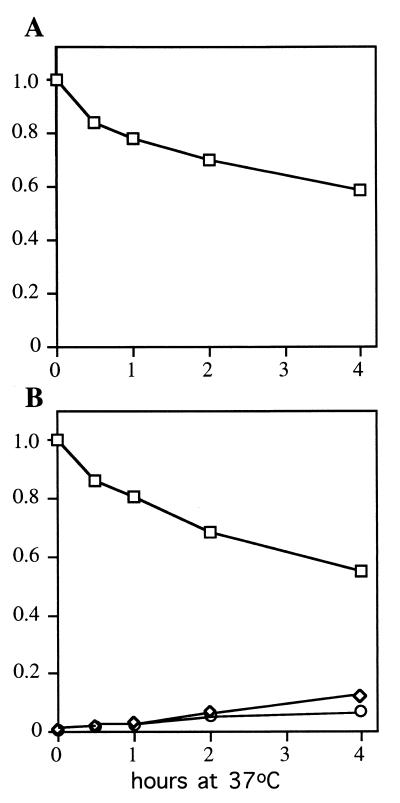
FIG. 4.
Kinetics of accumulation of snR13 RNAs following inactivation of Sen1p. Data from the Northern blot shown in Fig. 3A and from a duplicate experiment were quantitated with a PhosphorImager, averaged, and plotted. RNA accumulation levels were normalized by using SUF4 tRNA as a loading control. The data are expressed as a proportion of snR13F accumulation at time zero. (A) Accumulation of snR13F (□) at time intervals following a shift from 25 to 37°C in strain 1971 (SEN1). The abundances of snR13R and snR13T were too low for reliable quantitation. (B) Accumulation of snR13R (○), snR13F (□), and snR13T (◊) at time intervals following a shift from 25 to 37°C in strain FWY1 (sen1-1).

