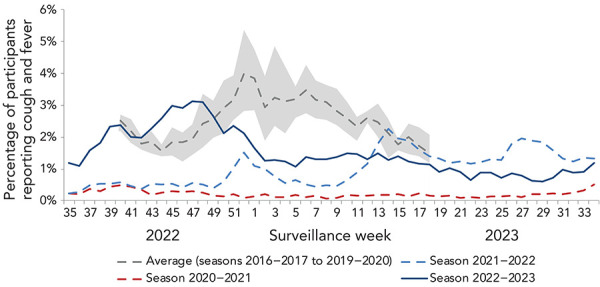
Figure 6.

Percentage of FluWatcher participants reporting cough and fever in Canada by season and surveillance weeka
a The shaded area represents the maximum and minimum percentage of FluWatcher participants reporting influenza-like illness by week from seasons 2016–2017 to week 11 of 2019–2020
