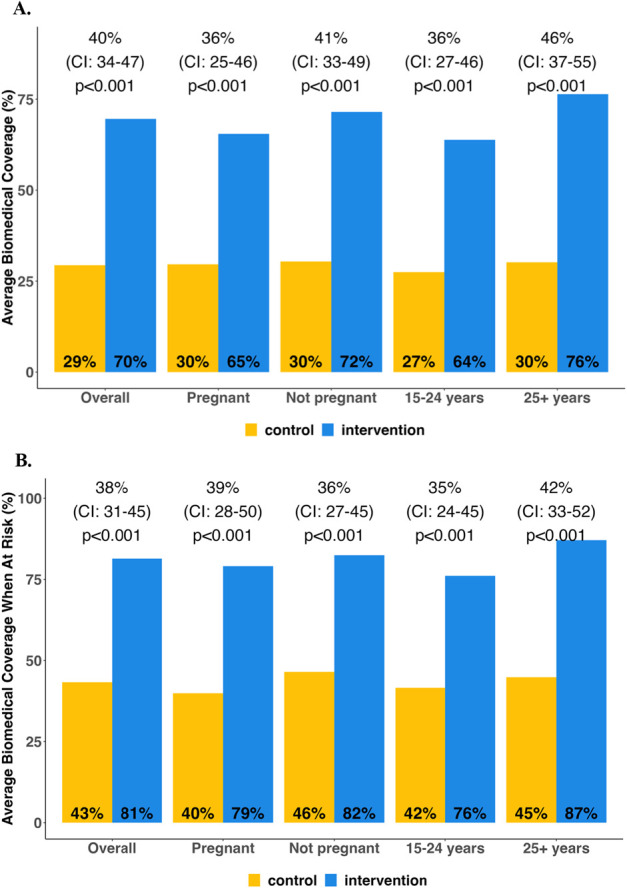
FIGURE 3.

Effect of intervention on proportion of follow-up time with self-reported use of PrEP or PEP, overall and by subgroups. A, Biomedical prevention coverage (primary outcome). B, Biomedical prevention coverage restricted to months with self-reported risk of HIV acquisition. Effect estimates regarding the difference in average biomedical prevention coverage between intervention and control arms.
