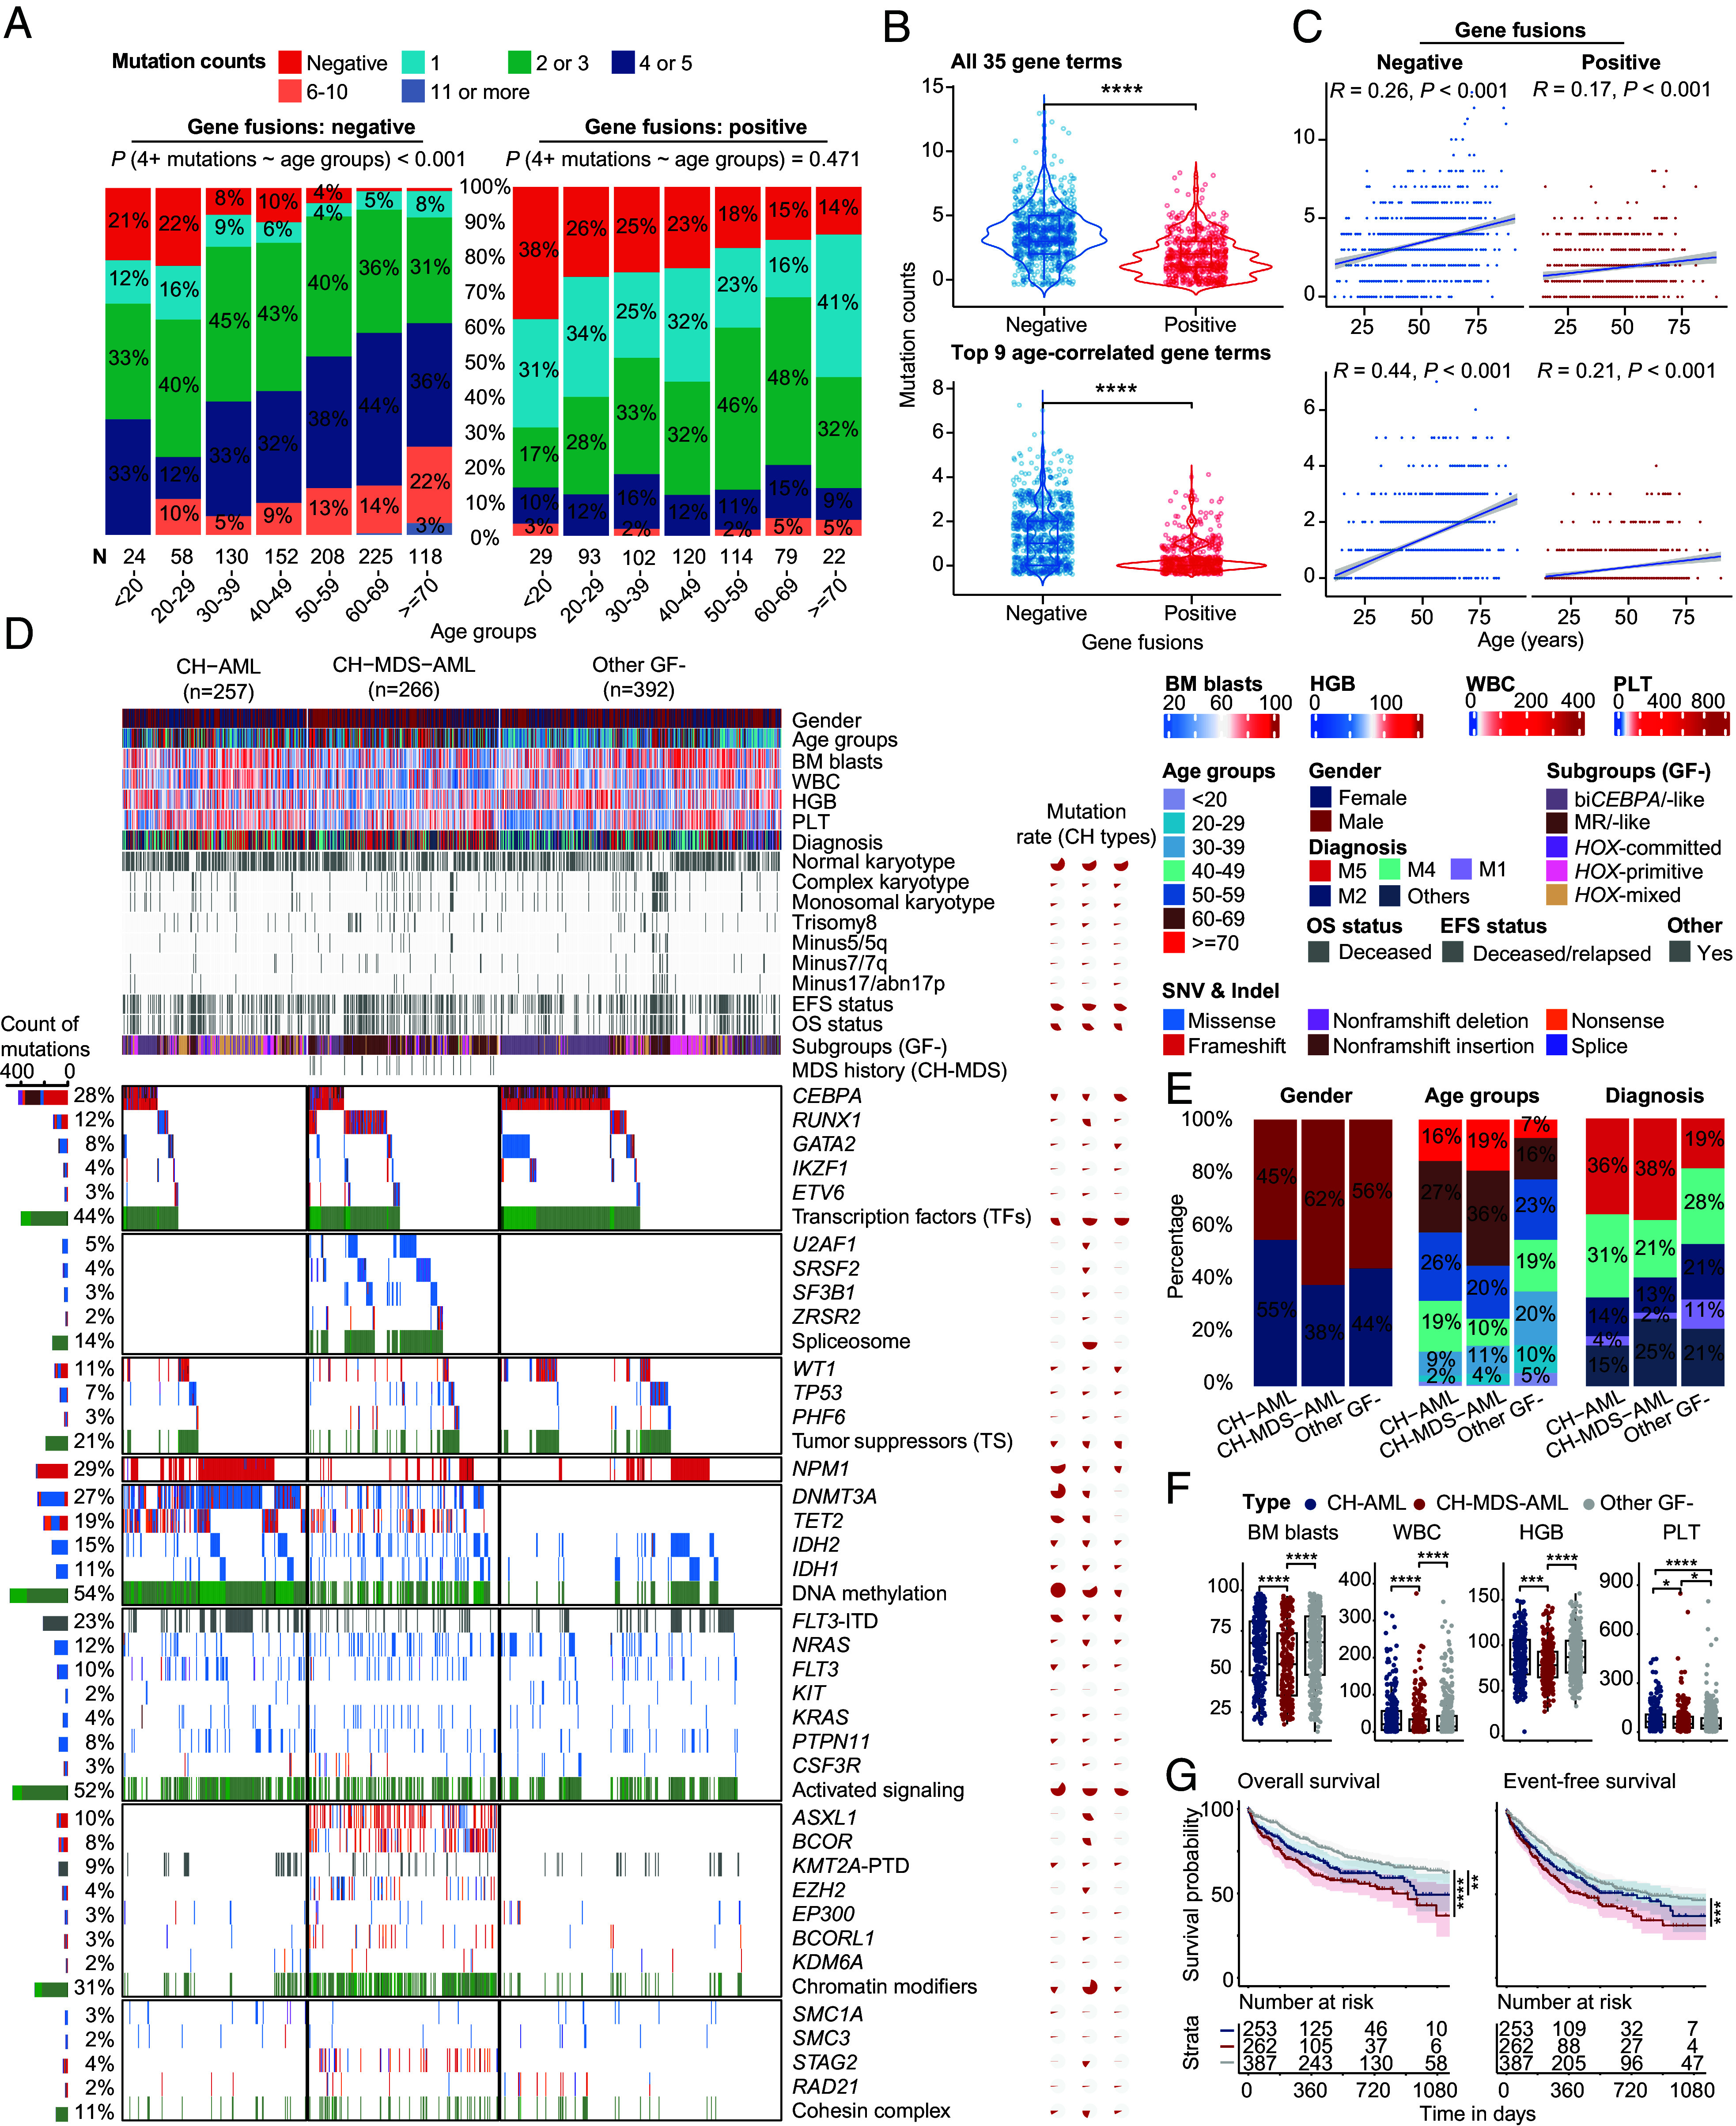
Fig. 3.

Genomic landscape of gene fusion–negative patients with AML. (A–C) compare the number of mutations between gene fusion–positive and gene fusion–negative patients with AML. (A) Percentage bar graphs show the classes of mutation numbers in gene fusion–negative (Left)/-positive (Right) groups. Gene fusion–negative patients have a higher rate of four or more mutations. (B) Violin plots show the difference in mutation numbers between gene fusion–negative/-positive groups. (C) Scatter plot of mutation number and age. Spearman correlations are shown in the Top. Regression line and the CI are shown. The Top and Bottom panels show all 35 gene mutation items and top 9 genes with age-related mutations, respectively. (D) Genomic landscape including clinical features, gene fusions, and genetic mutations of representative CH-related patients. CH-AML contains DNMT3A or TET2 genetic mutations, while the secondary mutations are negative. In contrast, patients in the CH-MDS-AML group contain at least one of the secondary-type mutations. Multicolored bars map the different types of gene mutations, representing the number of gene mutations. The percentage on the Left indicates the mutation rates of genes in all patients, while the pie chart on the Right shows the mutation rates of CH-AML, CH-MDS-AML and other GF- groups. (E) The bar plot shows the percentage difference of gender, age groups, diagnosis. (F) Boxplots show the difference of BM blasts, WBC, HGB, and PLT. (G) OS and EFS of CH-AML and CH-MDS-AML groups. Statistical significances of (B) and (F) were inferenced by the Wilcoxon signed-rank test. CH, clonal hematopoiesis. MDS, myelodysplastic syndromes. GF, gene fusion. BM, bone marrow. WBC, white cell count. HGB, hemoglobin. PLT, platelet. *P < 0.05; **P < 0.01; ***P < 0.001; ****P < 0.0001.
