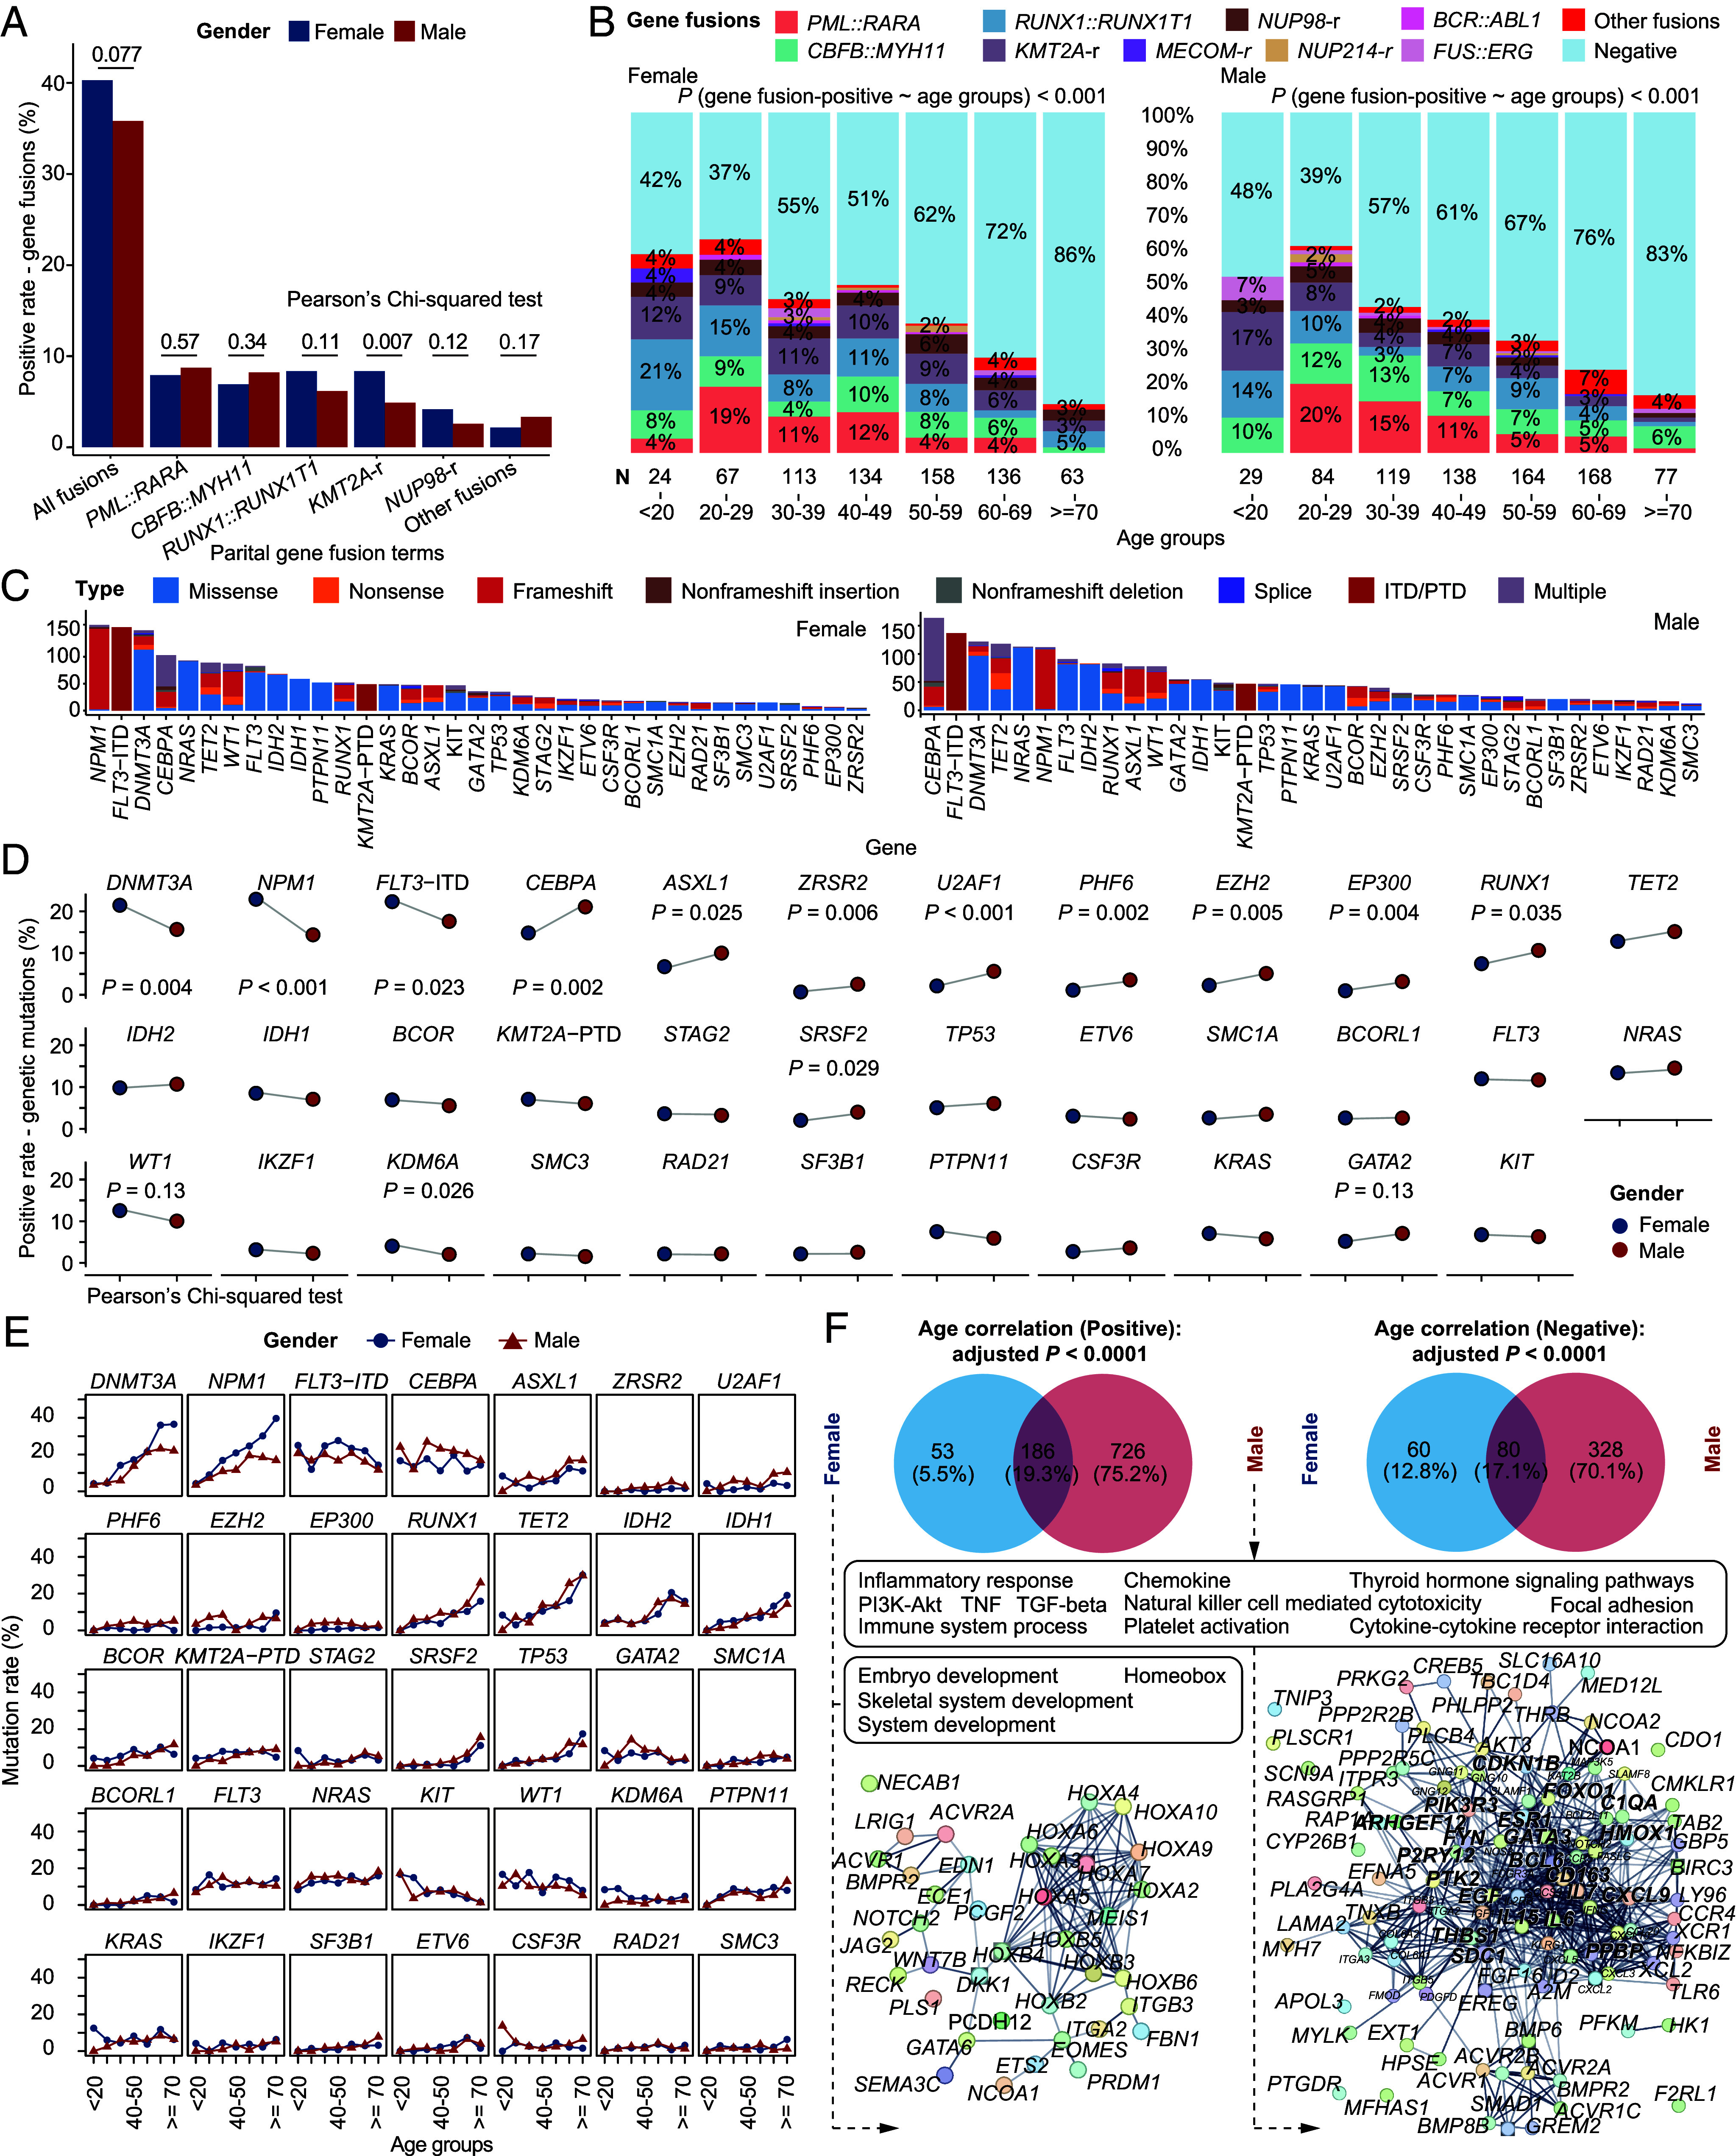
Fig. 5.

Gender differences in gene fusions, genetic mutations, and age-related gene expression markers in AML. (A) The bar chart shows the frequency of gene fusions between female (blue) and male (red). Females tend to have more gene fusions, mainly KMT2A and NUP98 gene fusions. (B) Positive rate of different classes of gene fusions in different age groups. High-frequency gene fusions decrease with age in both females and males, while rare gene fusions show higher incidence in older male AML patients. Logistic regressions indicate the decrease trend of gene fusions with age in male and female. (C–E) show the difference in the occurrence of gene mutations. (C) The bar chart shows the number of patients with common genetic mutations in female (Left) and male (Right). (D) Dot plots show the changes in proportions between females (blue dot) and males (red dot). (E) Dot plots show the sex difference of genetic mutations in different age groups. (F) Pathway enrichment analysis of genes with age-related expression profiles (adjusted P < 0.0001) in female and male highlighting the gender-related HOXA/B and inflammatory response pathways. Statistical significance of (A) and (D) is inferenced by the Pearson’s Chi-squared test.
