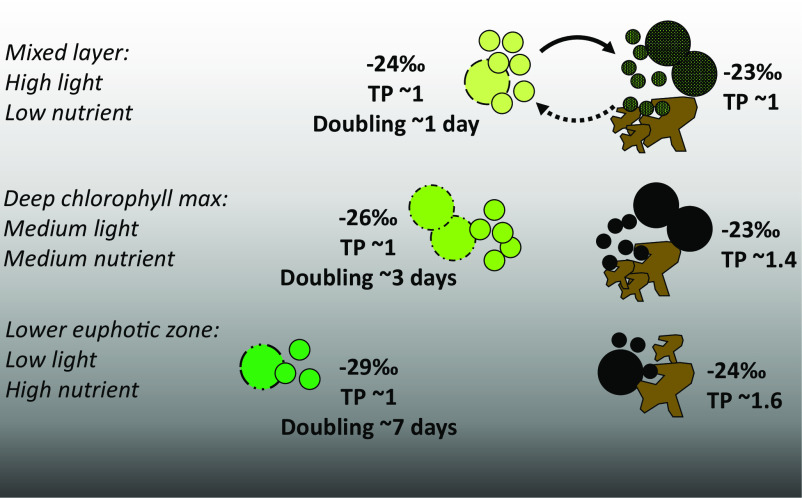
Fig. 4.
Conceptual portrayal of quantities and isotopic characteristics (biomass δ13C values and TP, trophic position) of phytoplankton and non-phytoplankton POM in a stratified, subtropical water column. Green circles represent phytoplankton, of which the phylogenies and chlorophyll content vary with depth; black circles represent heterotrophic microbes. Large and small circles indicate eukaryotes and prokaryotes, respectively. Brown shapes represent cell debris and other non-living detritus, which are grouped with heterotrophic cells in our calculations of non-phytoplankton isotopic properties. While we calculated the relative proportion of phytoplankton biomass and non-phytoplankton POM, the relative contribution of heterotrophic cells and non-living material to the latter is unknown currently. Relative specific growth rates of phytoplankton are indicated as doubling times [ln(2)*μ−1]. Nearly all culture studies of carbon isotopic fractionation have simulated conditions similar to those of the mixed layer.

