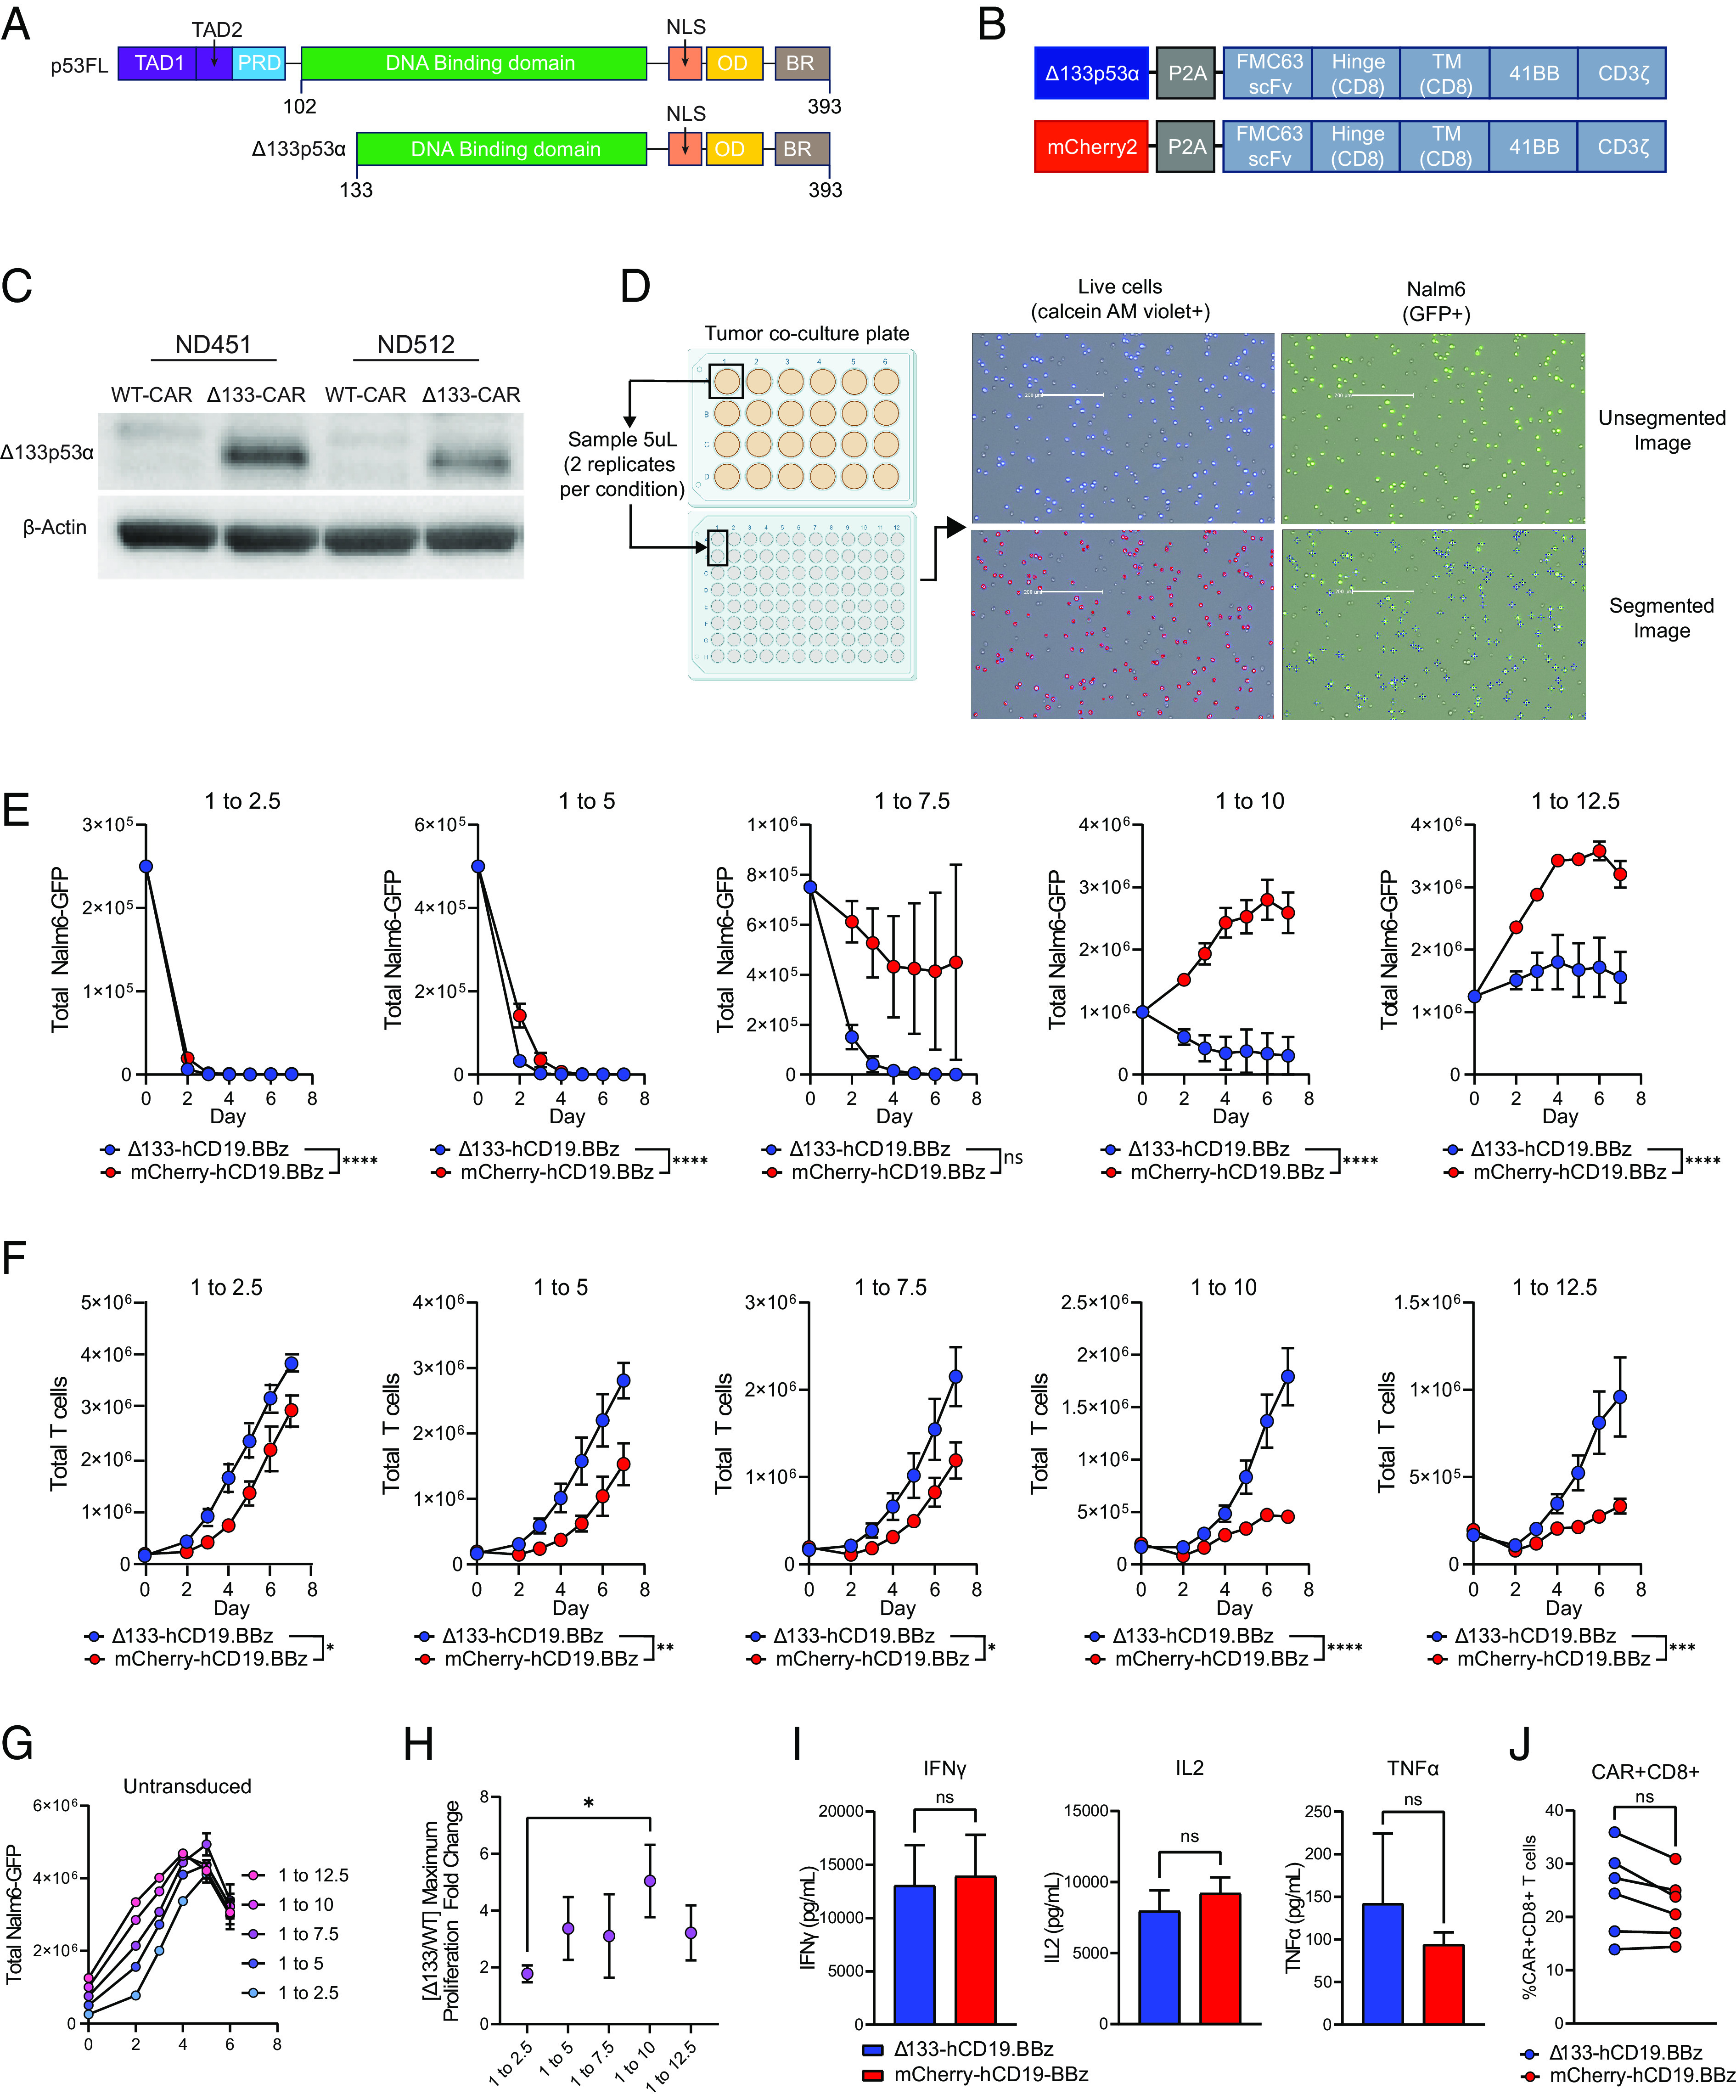
Fig. 1.

Δ133p53α-CAR T cells improve in vitro cytotoxicity and proliferation during high tumor burden conditions. (A) Schematic of human full-length p53 (p53FL) and Δ133p53α. TAD, transactivation domain; PRD, proline-rich domain; NLS, nuclear localization signal; OD, oligomerization domain; BR, basic region. (B) CAR expression vectors for Δ133p53α-expressing and WT, mCherry-expressing CARs. TM, transmembrane domain; WT, wild type. (C) Western blot for Δ133p53α expression in Δ133p53α CAR T cells and WT CAR T cells at day 10 of primary expansion from two normal donors. Δ133, Δ133p53α. (D) Schematic outlining in vitro co-culture assay setup and accompanying tumor and T cell measurements. Representative images show GFP+ tumor cells (Nalm6-GFP) and corresponding segmented images used for quantification by Celigo software. Live cells are identified by detection of fluorescent calcein AM violet, with total T cells being calculated by subtracting the number of GFP+ cells from the total number of live cells. Representative images showing segmentation and counting performed by Celigo software are shown. (E) Tumor measurements over time from in vitro co-culture assay described in D from six separate normal donors. Co-cultures were run at 5 effector to target ratios, indicated by the number over each graph. Data are mean ± SEM. Statistical significance was assessed using a two-way ANOVA, with reported values representing the interacting term of CAR treatment over time. (F) T cell proliferation during tumor co-culture from the same experiments shown in E. Data are from replicate experiments with six healthy donors. Statistical significance was assessed using a two-way ANOVA, with reported values representing the interacting term of CAR treatment over time. (G) Representative untransduced T cells co-cultured with Nalm6-GFP tumor cells, included as a negative control. (H) Ratio between maximum proliferation of Δ133p53α-CARs and wild-type CARs at each effector to target ratio. Maximum proliferation for each condition was determined as the maximum fold-change from baseline CAR T cells. Statistical significance was calculated using multiple t tests. (I) Cytokine secretion at 24-h time point of in vitro co-culture at 1 to 7.5 effector to target ratio. (J) Proportion of CAR+CD8+ T cells in each comparator group for each healthy donor used for data generated in E–H. Statistical significance for I and J was assessed using paired t tests. ns = not significant, *P 0.05, **P 0.01, ***P 0.001, ****P 0.0001.
