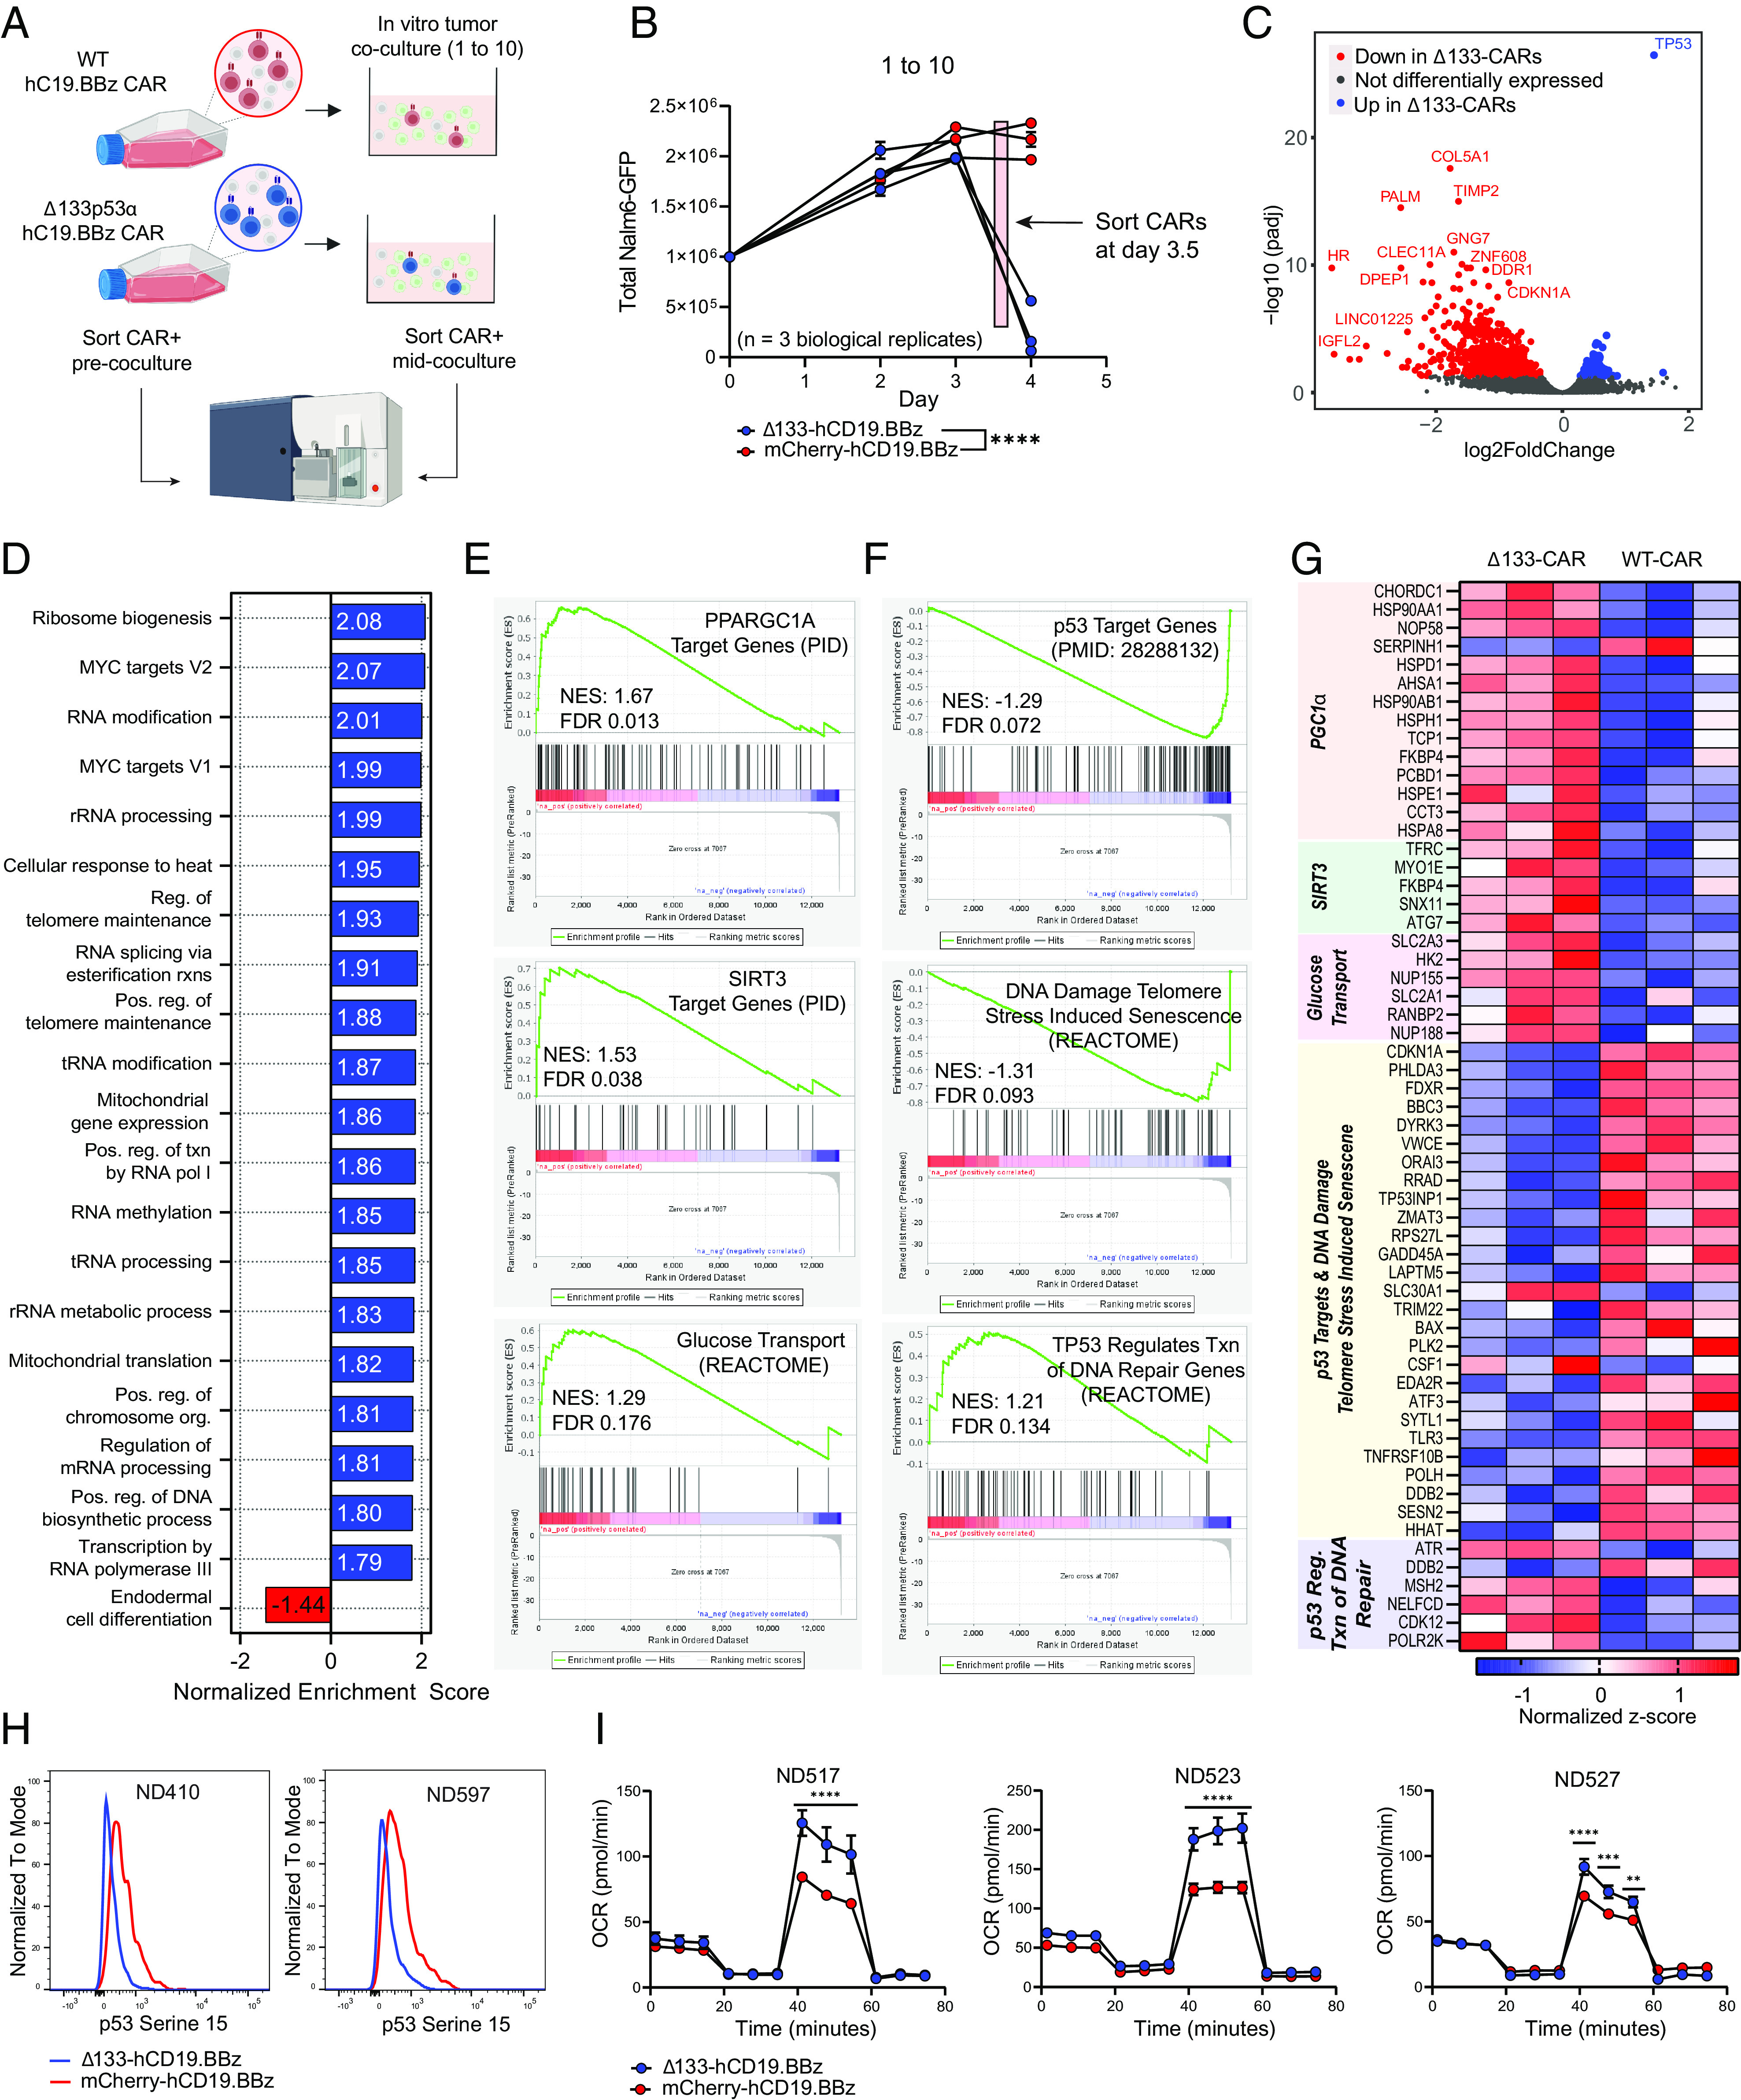
Fig. 3.

Transcriptomic analysis of Δ133-CAR T cells under stress reveals differences in transcription of p53 targets and key metabolic genes. (A) Schematic of sample generation for RNAseq analysis. CAR+ T cells were isolated prior to co-culture (day 0) and again mid-coculture, approximately 8 h prior to day 4 measurement. CAR T cells from the same three healthy donors were used for both isolations. (B) Tumor co-culture experiment used to generate CARs for RNAseq analysis. An effector to target ratio of 1 to 10 was used. Each data point represents the mean ± SEM of two technical replicates for each healthy donor. Statistical significance was determined via two-way ANOVA and is based on the CAR treatment X time interaction term. (C) Volcano plot showing differentially expressed genes in WT CAR T cells and Δ133-CAR T cells isolated mid-coculture. All genes with an adjusted P-value ≤ 0.05 are colored either red or blue, if upregulated in WT or Δ133-CARs, respectively. (D) Summary of results for GSEA of all Hallmark and GO Biological Process gene sets. For Δ133-CARs, only the top 20 of the 80 gene sets with FDR < 0.1, ranked by normalized enrichment score are shown. (E) Additional gene sets identified during targeted GSEA for metabolic gene sets relevant for CAR T cell function. (F) Additional gene sets identified during targeted GSEA for p53 transcriptional activity. (G) Heatmap of individual genes from gene sets in E and F with adjusted P-values ≤ 0.05. Corresponding gene sets for each gene are highlighted in vertical text. (H) Phospho-p53 (Serine 15) staining of CAR T cells on day 3 of tumor co-culture for two healthy donors measured by flow cytometry. (I) Oxygen consumption rate (OCR) as measured by Seahorse extracellular flux analysis. Each of the three healthy donors was evaluated following tumor co-culture. Data points for each time series represent mean oxygen consumption rate ± SEM for eight replicates. Statistical significance was determined using multiple unpaired t tests for each time point. ns = not significant, *P 0.05, **P 0.01, ***P 0.001, ****P 0.0001.
