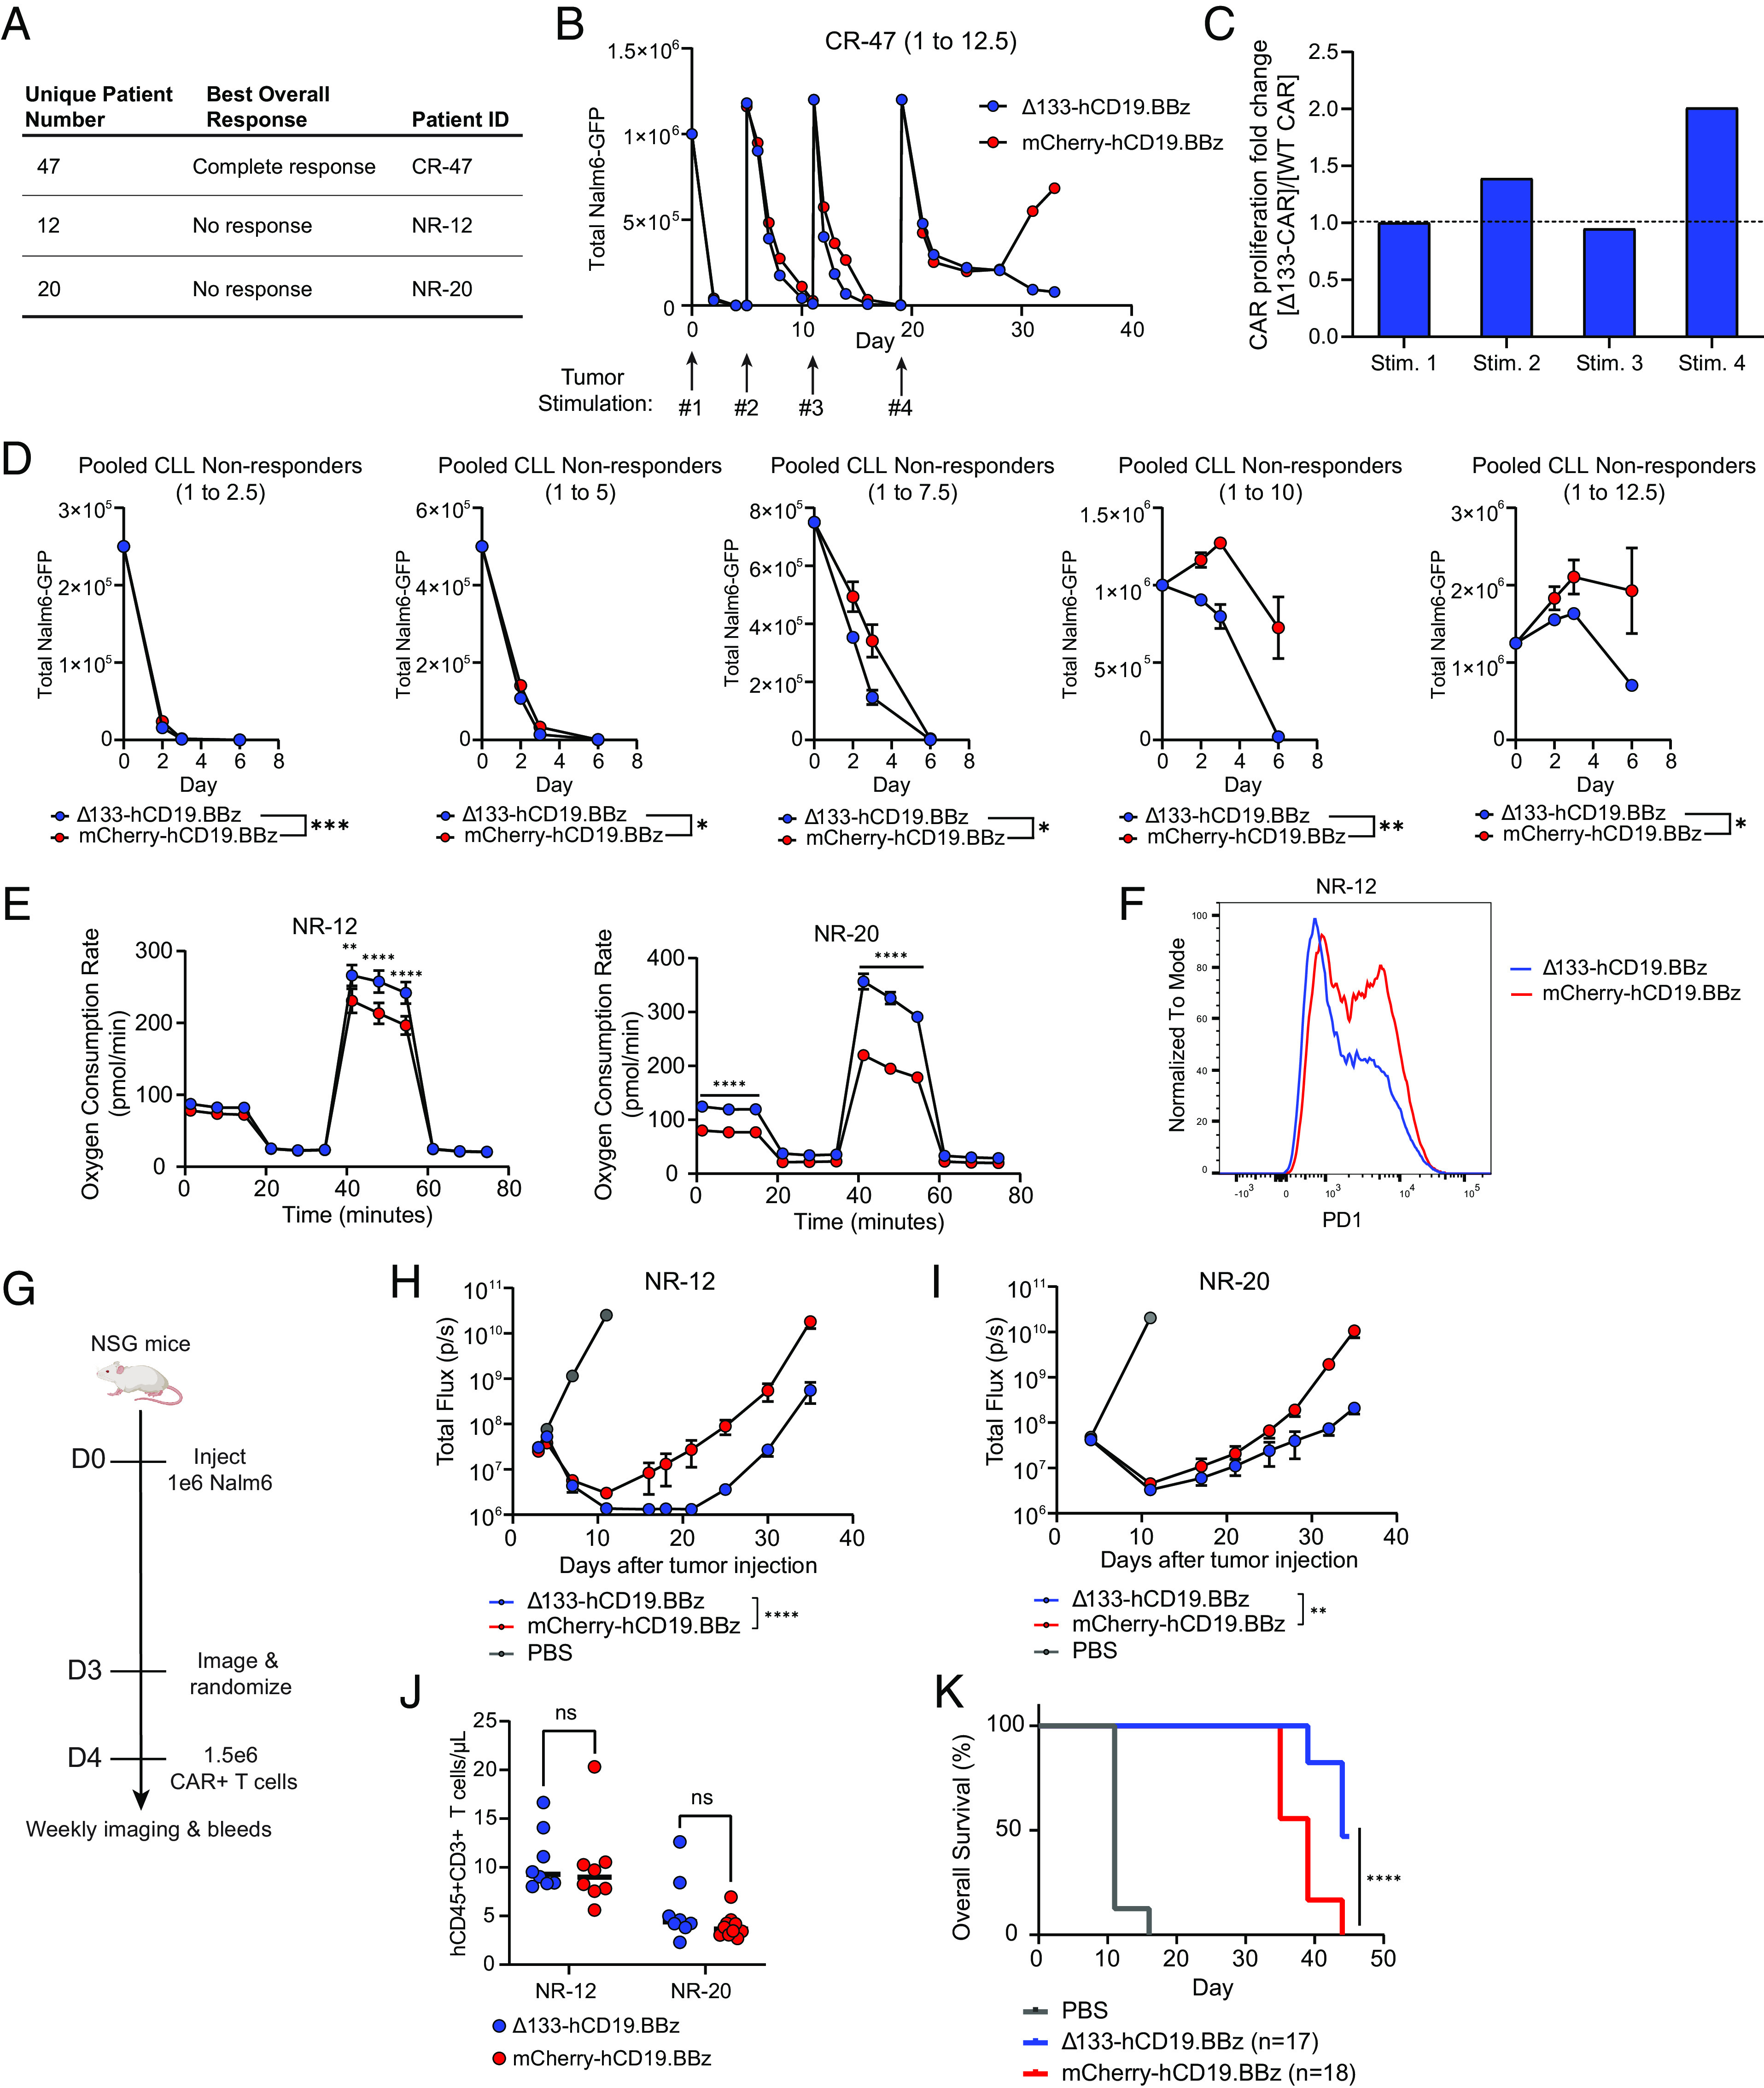
Fig. 4.

Δ133p53α expression in non-responding leukemia patient CAR T cells improves in vitro and in vivo efficacy. (A) Table outlining CLL patient T cells used for CAR manufacturing alongside clinical response to initial CD19-directed CAR T cell therapy. (B) In vitro tumor co-culture data for CR-47. Data shown are for an effector to target ratio of 1 to 12.5, with the timing of fresh tumor stimulations indicated by arrows. For each tumor restimulation, the number of CARs was normalized between treatment groups prior to tumor addition. Data are mean ± SEM of two technical replicates. (C) Ratio of population doublings between Δ133-CARs and WT CARs at the end of each tumor stimulation for CR-47. (D) Pooled tumor measurements over time from in vitro co-culture from NR-12 and NR-20. Co-cultures were run at 5 effector to target ratios, as indicated by the number over each graph. Data are mean ± SEM. Statistical significance was assessed using a two-way ANOVA, with reported values representing the interacting term of CAR treatment over time. (E) Oxygen consumption rate as measured by Seahorse extracellular flux analysis following co-culture at 1 to 4 E:T ratio. Data points for each time series represent mean oxygen consumption rate ± SEM for eight replicates. Statistical significance was determined using multiple unpaired t tests for each time point. (F) Surface PD1 staining of CAR T cells from NR-12 on day 5 of tumor co-culture at an effector to target ratio of 1 to 8 measured by flow cytometry. (G) NSG mice were injected intravenously with 1 × 10⁶ Nalm6 leukemia cells transduced with GFP-P2A-CBG on day 0. Mice were imaged on day 3 and randomized into three groups, including both treatment groups and a PBS control. Then, 1.5 × 10⁶ freshly thawed CAR+ T cells were injected intravenously on day 4. (H) Tumor progression for mice administered CARs from NR-12 monitored using bioluminescent imaging. Data are mean ± SEM of n = 8 mice. Statistical significance was determined via two-way ANOVA and is based on the CAR treatment X time interaction term. (I) Tumor progression for mice administered CARs from patient NR-20 monitored using bioluminescent imaging. Data are mean ± SEM of n = 8 mice. Statistical significance was determined via two-way ANOVA and is based on the CAR treatment X time interaction term. (J) T cell engraftment 1-week post-CAR injection for NR-12 and NR-20. Statistical significance was determined using a paired t test. (K) Kaplan–Meier curves showing survival of mice from both NR-12 and NR-20 over time. Data were analyzed using a log rank Mantel–Cox test. ns = not significant, *P 0.05, **P 0.01, ***P 0.001, ****P 0.0001.
