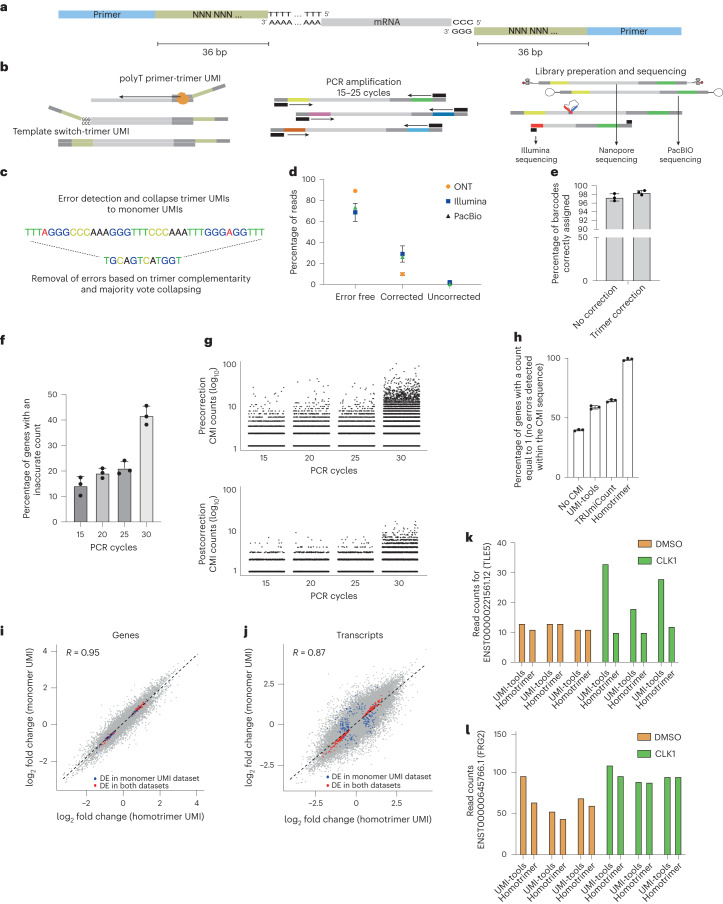
Fig. 1. Enhanced accuracy in bulk mRNA sequencing using homotrimer UMI-based approach to mitigate PCR-induced errors.
a, A schematic showing attachment of 3′ and 5′ UMIs to mRNA. b, A schematic showing the homotrimeric UMI approach. c, Errors are then corrected using the homotrimer correction method. d, Percentage of CMIs that are correctly sequenced and then error corrected using homotrimer correction across Illumina, PacBio and ONT sequencing platforms. Experiments for Illumina and ONT were performed in triplicate, whereas PacBio sequencing was conducted as a single run. Parameters for simulations: sequencing error rate 0.001, length of UMI 8, PCR cycles 10 and PCR error rate 0.000001 e, Barcode assignment using homotrimer barcodes before and after majority vote correction. f, Percentage of genes with an accurate CMI count following increased PCR cycles of the same sequencing library. Data shown in the figure are from one single run. g, log10 CMI counts plotted for each transcript pre- and postmajority vote correction. Each dot represents an individual transcript (the ground truth count for each transcript should be equal to 1, any counts above this are indicative of an error). The data in this figure are representative of one sample in f. h, Percentage of genes with an accurate CMI count following 20 PCR cycles then using ONT sequencing and counting using UMI-tools, TRUmiCount correction and homotrimer error correction. i–l, RM82 sarcoma cells were treated with DMSO or SGC-CLK-1 for 24 hours and then sequenced using the PromethION platform. i,j, Scatter plot of the log2 fold changes obtained from randomly collapsing each sequenced trimer UMI and then applying UMI-tools deduplication versus the log2 fold changes obtained from homotrimer UMI correction and counting for genes (i) and transcripts (j). Red points indicate the overlapping significant genes and/or transcripts and blue points indicate genes and/or transcripts that were disconcordantly significantly differentially expressed. DE, differential expression. k, TLE5 transcript read counts showing the expression for DMSO and SGC-CLK1 following the application of UMI-tools or homotrimer correction. l, FRG2 transcript read counts showing the expression for DMSO and SGC-CLK1 following the application of UMI-tools or homotrimer correction. For k and l, three replicates are shown for each condition. d,e,f and h, Error bars represent standard deviation (s.d.) from three independent experiments.

