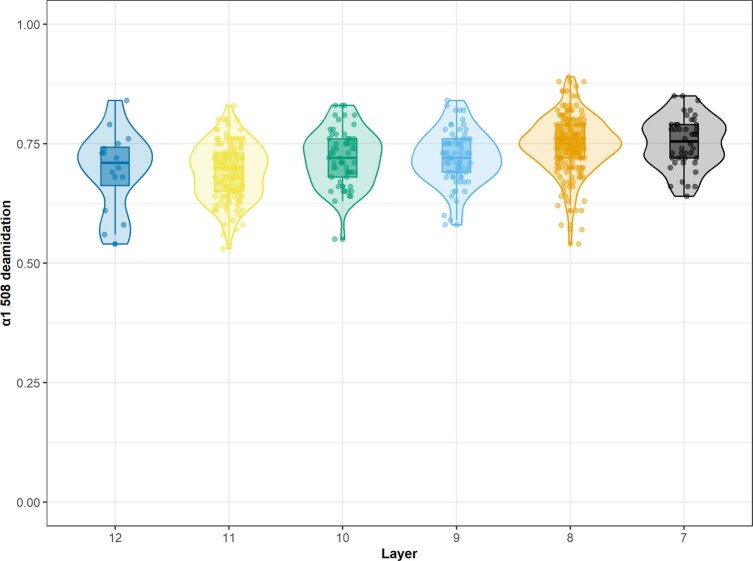
Extended Data Fig. 3.
Glutamine deamidation values for α1 508 of the bone fragments analysed through ZooMS. These are seen as an indicator for the biomolecular preservation of the bone. Sample sizes are Layer 7 (n = 44), Layer 8 (n = 190), Layer 9 (n = 69), Layer 10 (n = 61), Layer 11 (n = 133) and Layer 12 (n = 16); see SI Tables 14 and SI Table 15. Box plot in Extended Data Fig. 3: box extends from first quartile (Q1 on left) to third quartile (Q3 on right) with bold line in middle representing (median); Lines extending from both ends of the box indicate variability outside Q1 and Q3; minimum/maximum whisker values are calculated as Q1/Q3 -/ + 1.5 * IQR. Everything outside is represented as an outlier.

