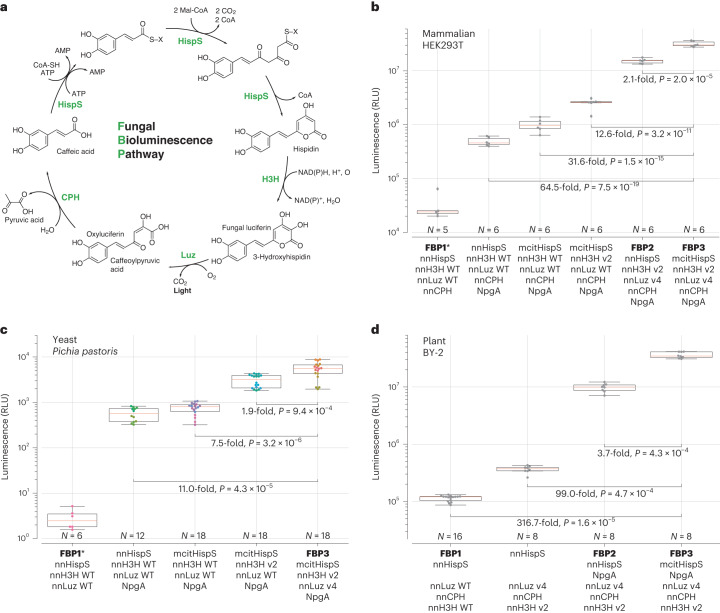
Fig. 1. Optimization of the fungal bioluminescence pathway in cell culture systems.
a, Biochemical reactions of the fungal bioluminescence pathway are catalyzed by hispidin synthase HispS, hispidin-3-hydroxylase H3H, luciferase Luz and putative caffeoyl pyruvate hydrolase CPH. Optimization of HispS, H3H and Luz-catalyzed steps resulted in two improved versions of the pathway: FBP2 and FBP3. b–d, FBP2 and FBP3 outperform the wild-type (WT) pathway when expressed in mammalian (b), yeast (c) and plant (d) hosts. In experiments in mammalian cells and yeast, each gene was delivered on a separate plasmid; in case of plants, plasmids encoding all genes were used. Experiments in plants and in yeast were performed at room temperature, and in mammalian cells at 37 °C. For mammalian cells, 100 µM caffeic acid was used, and for yeast 100 mM. Comparison in yeast was performed in strains lacking nnCPH. Asterisk indicates samples where luminescence level was close to that of the background; for that reason, fold-change values are not provided. The boxes are the first and the third quartiles, whiskers are the rest of the distribution except outliers, and the orange line is the median. The color of data points in c indicates different yeast strains. The difference between mean values and P values of post-hoc two-sided Conover test (b) or Mann–Whitney U tests (c and d) corrected by the step-down method using Šidák adjustments are indicated below the brackets between the box plots. Kruskal–Wallis H test: H-statistic 33.07, P = 3.6 × 10⁻⁶ (b), H-statistic 61.01, P = 1.8 × 10⁻¹² (c), H-statistic 35.59, P = 9.1 × 10⁻⁸ (d). N = 5–6 biologically independent samples (b); 6–18 biologically independent samples (c); 8–16 plant cell packs (d).

