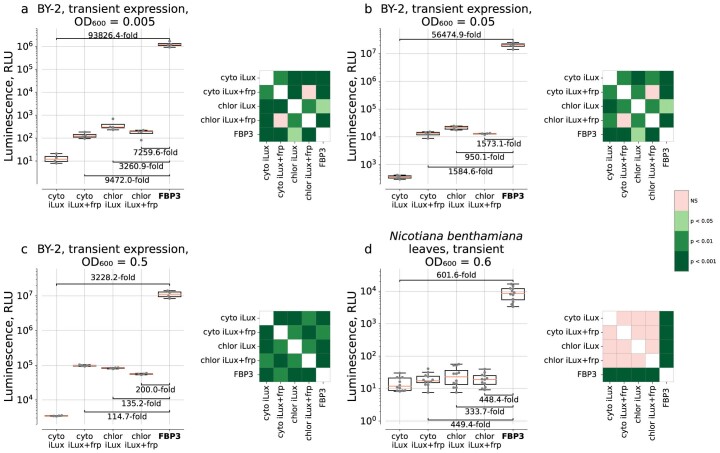
Extended Data Fig. 9. Autonomous luminescence conferred by bacterial and fungal pathways in plant cells.
(a–c) Luminescence of BY-2 cells infected by different amounts of agrobacteria, expressed as OD600. (d) Luminescence of N. benthamiana leaves. In these experiments, each gene was delivered on a separate plasmid. cyto stands for cytoplasmic localisation of iLux enzymes, chlor – for plastid localisation. Box and whisker plots (left) are accompanied by colour-coded p-values of post-hoc two-sided Conover’s test (right) corrected by the step-down method using Sidak adjustments. NS — non-significant. The boxes are the first and the third quartiles, whiskers are the rest of the distribution except outliers, the orange line is the median. N = 4 plant cell packs per box plot (a, b, c) or 12 leaves per box plot (d). The difference between mean values is indicated below the brackets between the box plots. Kruskal-Wallis H Test: H-statistic = 17.60, p = 1.5e-03 (a), H-statistic = 17.39, p = 1.6e-03 (b), H-statistic = 18.29, p = 1.1e-03 (c) and H-statistic = 30.86, p = 3.3e-06 (d).

