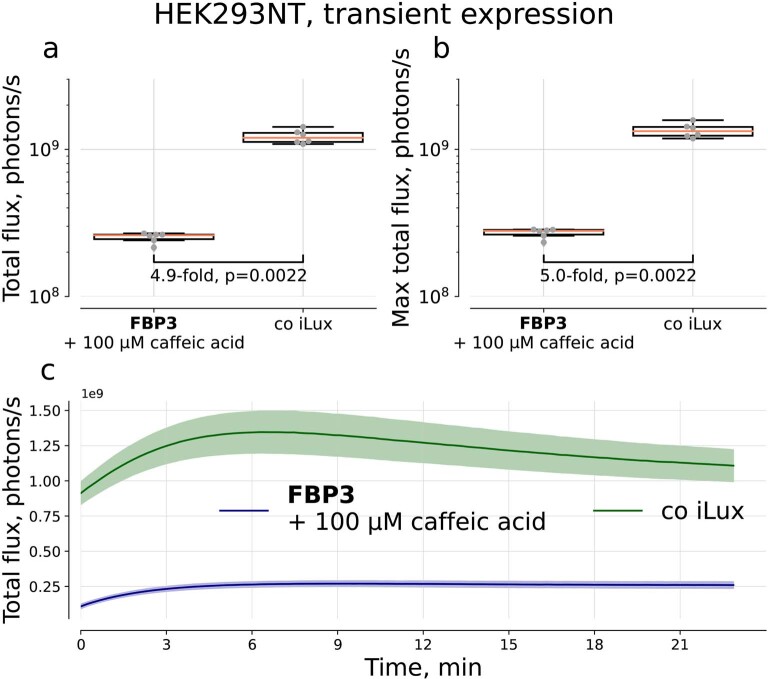
Extended Data Fig. 10. Comparison of autonomous bacterial bioluminescent system with FBP3 pathway after treatment with 100 µM caffeic acid in transient expression in HEK293NT.
(a) Average signal collected over 20 min. N = 6 biologically independent samples per box plot. (b) Maximum signal. The boxes are the first and the third quartiles, whiskers are the rest of the distribution except outliers, the orange line is the median. The difference between mean values and p-values of post-hoc two-sided Mann-Whitney U-tests are indicated below the brackets between the box plots (c) Kinetics. Data shown as mean (solid line) ± SD (area around the solid line).

