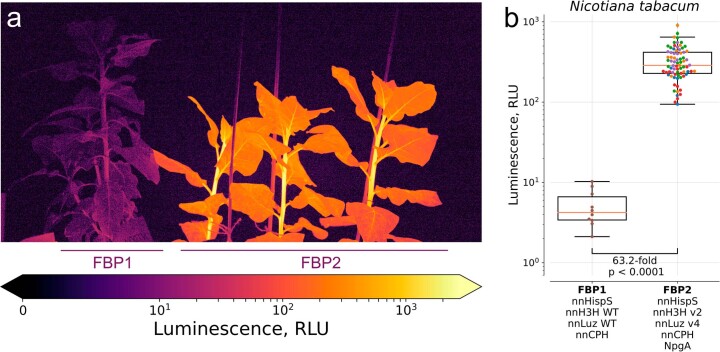
Extended Data Fig. 6. Imaging of 4-week-old N. tabacum transformed with FBP1 or FBP2.
The FBP1 is the plant line NT001 reported in ref. 7. The photo (ISO 400, exposure 30 sec) (a) and average luminescence of leaves (b). The boxes are the first and the third quartiles, whiskers are the rest of the distribution except outliers, the orange line is the median. The colour of data points indicates different plant lines (NT001 for FBP1, 5 lines for FBP2); N = 10 and N = 77 leaves for FBP1 and FBP2, respectively. The difference between mean values and p-value of post-hoc two-sided Mann-Whitney U-test are indicated below the brackets between the box plots, p = 3.1e-07.

