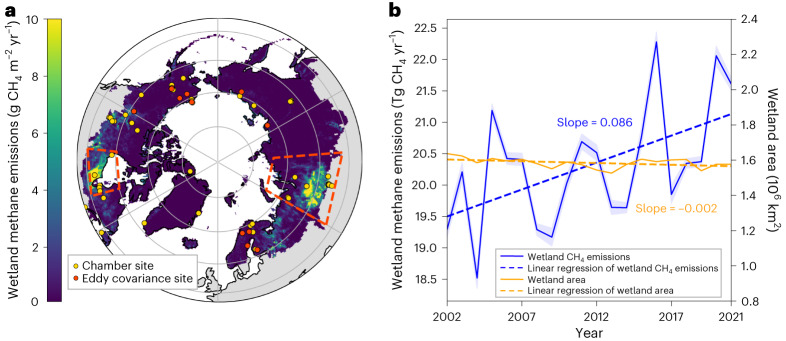
Fig. 1. Significant increasing trend of wetland CH4 emissions in the Boreal–Arctic during 2002–2021.
a, Spatial distribution of the long-term averaged wetland CH4 emissions in the Boreal–Arctic upscaled by combining chamber and EC datasets. Red dashed boxes indicate two wetland hotpots: WSL (52–74° N, 60–94.5° E) and HBL (50–60° N, 75–96° W). Boreal–Arctic basemap data from ref. 72. b, Annual Boreal–Arctic wetland CH4 emissions and Wetland Area and Dynamics for Methane Modeling (WAD2M) wetland area dataset between 2002 and 2021. Dashed lines indicate the linear regression results for wetland CH4 emissions (P = 0.017, two-sided t-test) and wetland area (P = 0.064). The blue shaded area indicates the s.d. in estimated wetland CH4 variability due to model parameter uncertainty.

