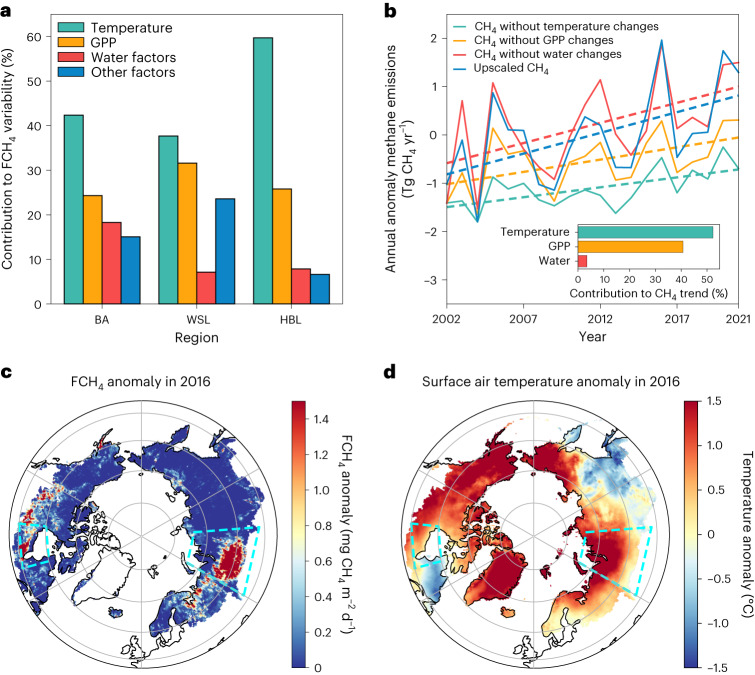
Fig. 2. Temperature dominated the variability and trend of wetland CH4 emissions, and triggered the peak CH4 emissions in 2016.
a, Contribution of abiotic and biotic drivers to wetland CH4 flux (FCH4) variability in the Boreal–Arctic (BA), WSL and HBL, represented as the percentage of grids where wetland FCH4 variability is dominated by temperature, GPP, water-related drivers (soil moisture content, and precipitation) and other drivers. b, Upscaled CH4 emission annual anomalies (solid lines) and trends (dashed lines) using all drivers and iteratively excluding the temporal dynamics for each group of drivers. Inset: contributions of different drivers to the CH4 emission trend (Methods). c,d, CH4 emission anomalies calculated relative to the multiyear annual-mean CH4 emissions from 2002 to 2021: anomaly of FCH4 (c) and surface air temperature73 (d) in the peak emission year of 2016. The regions marked with dashed boxes are two wetland hotpots: WSL and HBL.

