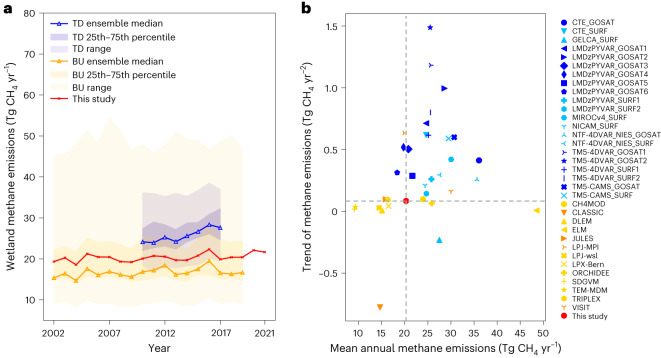
Fig. 3. BU and TD models exhibited substantial uncertainties in the magnitude and trend of wetland CH4 emissions over the Boreal–Arctic region.
a, The multimodel ensemble median (50th percentile) of wetland CH4 emissions estimated by TD (blue line) and BU (orange line) models, compared with the upscaled wetland CH4 emissions (red line). The darker shaded areas represent 25th to 75th percentiles and the lighter shaded areas represent the ranges of wetland CH4 emissions. b, The mean annual magnitudes and trends of wetland CH4 emissions estimated by TD and BU models, compared with those of the upscaled wetland CH4 emissions (red circle). For TD models, dark-blue markers indicate that the trends are significant, that is, P < 0.05, and light-blue markers indicate that the trends are not significant, that is, P > 0.05. For BU models, orange markers indicate that the trends are significant, and yellow markers indicate that the trends are not significant. The P values can be seen in Supplementary Table 5, obtained from a two-sided t-test.

