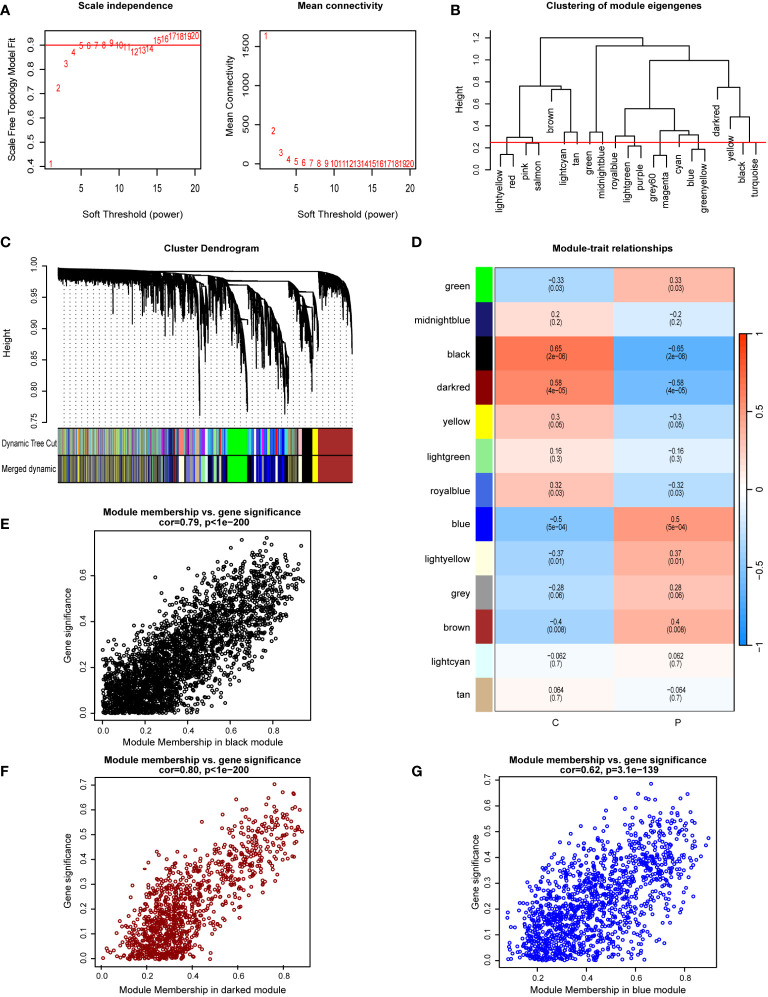
Figure 2.
Implementation of WGCNA and identification of key module genes. (A) A soft-thresholding power (β) was set at 15, ensuring a scale-free R2 = 0.9. (B) Hierarchical clustering dendrogram of module eigengenes. (C) The cluster dendrogram of co-expression network modules from WGCNA depending on a dissimilarity measure. (D) Module-trait relationships between: comparing the control group (C) with the NAFLD group (P). (E) The scatterplot for the black module displays the relationship between module membership and gene significance. (F) The scatterplot for the darkred module displays the relationship between module membership and gene significance. (G) The scatterplot for the blue module displays the relationship between module membership and gene significance.

