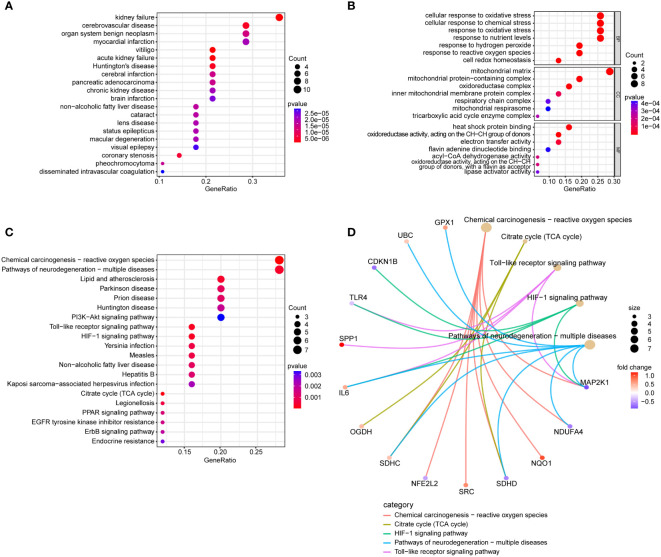
Figure 4.
Conducting functional enrichment analysis of 31 intersection genes of NAFLD and OS. (A) The DO enrichment analysis reveals the diseases most significantly associated with the 31 intersecting genes. (B) The GO enrichment analysis elucidates the functional roles of the 31 intersecting genes from three perspectives: BP, CC, and MF. (C) The KEGG enrichment analysis bubble plot displays the signaling pathways most closely related to the 31 intersecting genes. (D) The KEGG enrichment analysis circular network plot presents a network of relationships between some genes and their associated signaling pathways.

