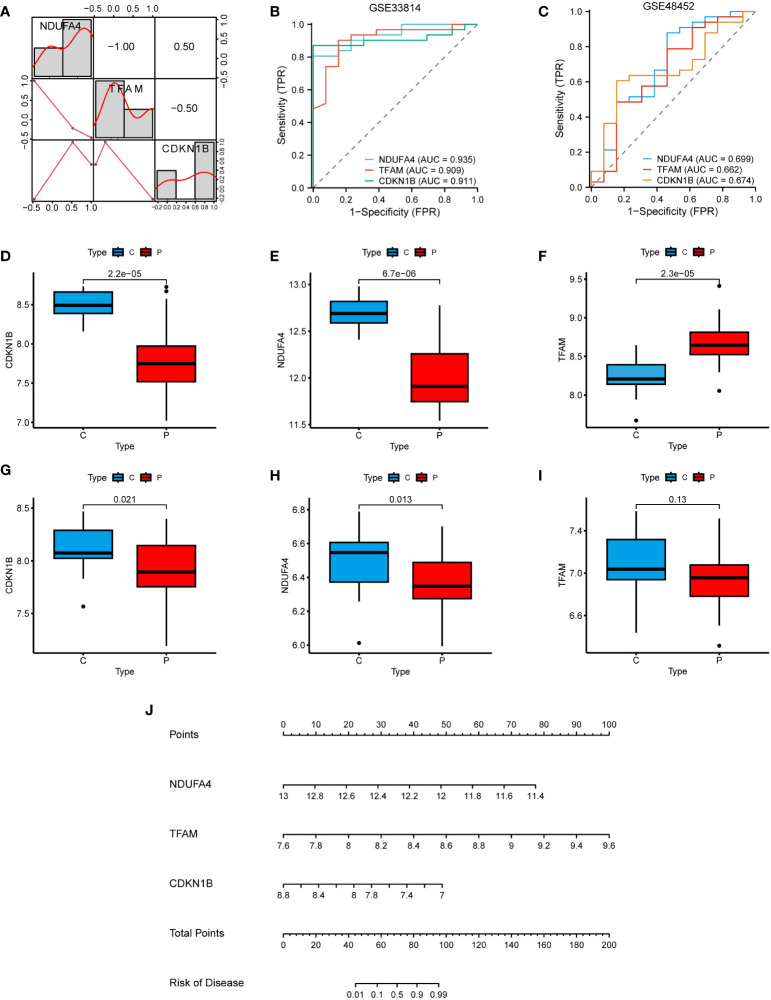
Figure 7.
Clinical studies of the hub genes. (A) Correlation heatmap of the 3 hub genes. (B) ROC curve in the GSE33814. (C) ROC curve in the GSE48452. (D–F) Hub genes expression in the GSE33814: comparing the control group (C) with the NAFLD group (P). (G–I) Hub genes expression in the GSE48452: comparing the control group (C) with the NAFLD group (P). (J) Nomogram for the diagnosis of NAFLD based on the hub genes.

