Figure 8.
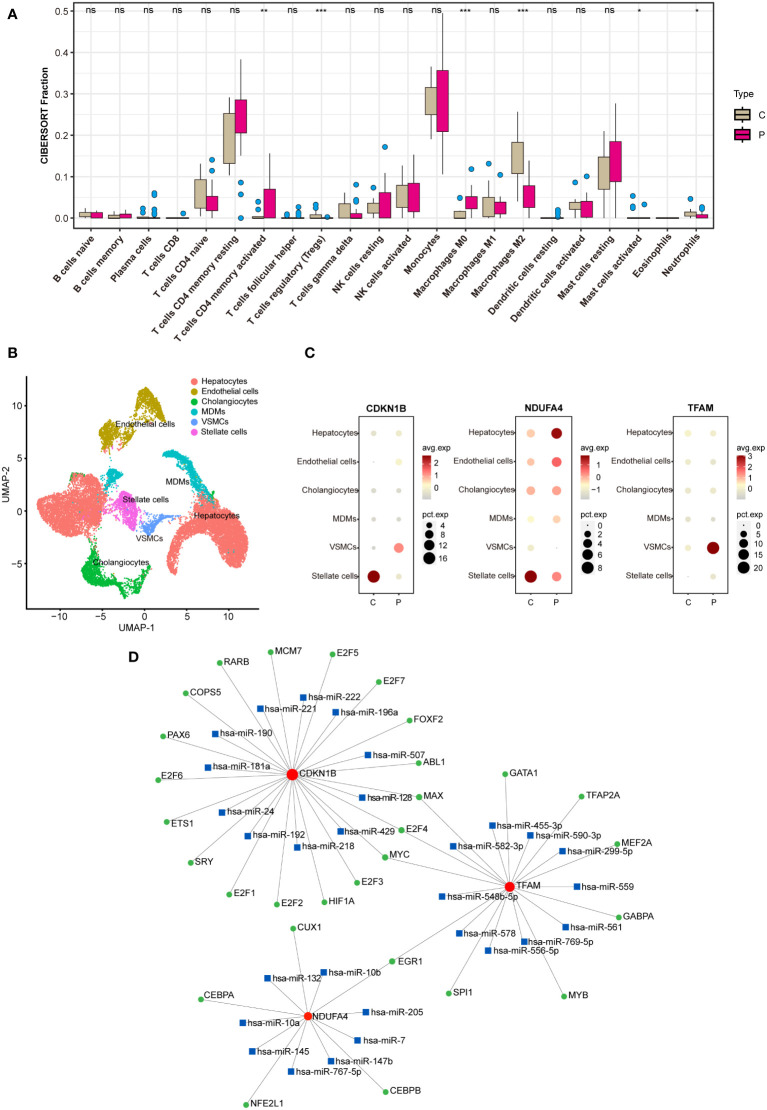
Analysis on immunization and TF-miRNA-mRNA regulatory network. (A) Immune infiltration analysis between the NAFLD group and the control group. (B) Analysis of the single-cell RNA sequencing dataset GSE189600. (C) Hub genes enrichment in immune cells. (D) TF-miRNA-mRNA regulatory network. In B, C, and D, “C” represents the control group, and “P” represents the NAFLD group. "ns" indicates not significant, "*" indicates P<0.05, "**" indicates P<0.01, "***" indicates P<0.001.

