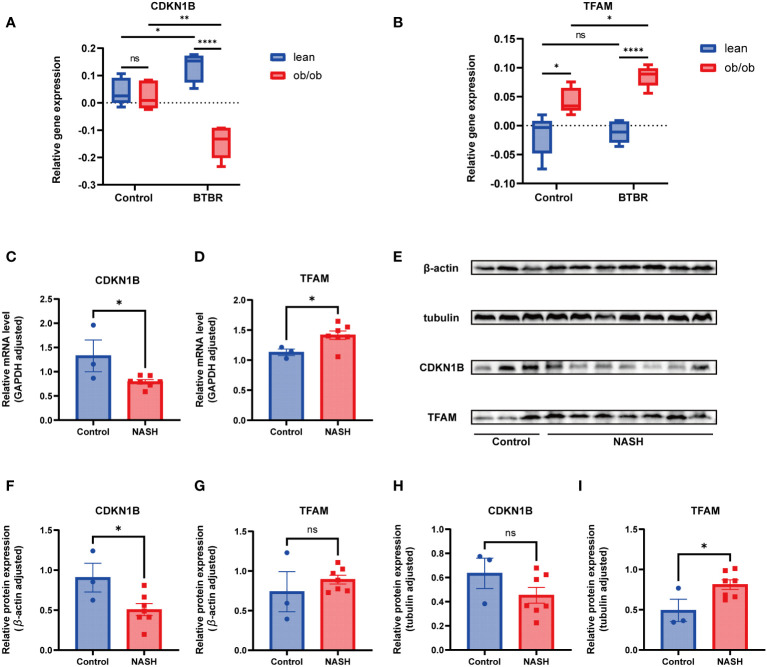
Figure 9.
Animal experimentation (A) Comparison of CDKN1B relative gene expression in lean and ob/ob groups of 10-week-old C57BL/6 and BTBR strain mice, using mlratio to quantify changes. (B) Comparison of TFAM relative gene expression in lean and ob/ob groups of 10-week-old C57BL/6 and BTBR strain mice, using mlratio to quantify changes. (C) Relative mRNA levels of CDKN1B in control and NASH mice. (D) Relative mRNA levels of TFAM in control and NASH mice. (E) Comparison of protein expression levels for CDKN1B and TFAM. (F) Statistical analysis of CDKN1B protein expression, standardized by β-actin. (G) Statistical analysis of TFAM protein expression, standardized by β-actin. (H) Statistical analysis of CDKN1B protein expression, standardized by tubulin. (I) Statistical analysis of TFAM protein expression, standardized by tubulin. "ns" indicates not significant, "*" indicates P<0.05, "**" indicates P<0.01, "***" indicates P<0.001.

