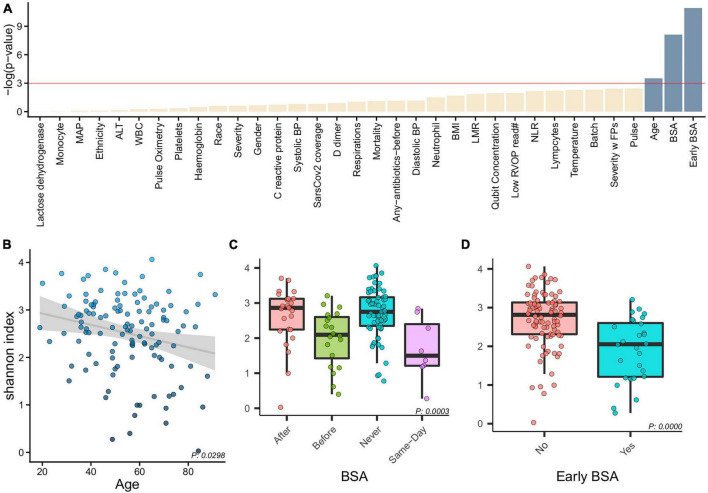
FIGURE 2.
Alpha diversity and clinical characteristics. (A) Associations between alpha diversity and sample clinical information (x-axis) and statistical significance (–log(p-value)–y-axis) with a horizontal red line showing the –log(0.05) cutoff for significance. With age, BSA and early BSA showing significance, we show alpha diversity against the categorizations of each of these clinical variables, namely, (B) Age, (C) BSA, and (D) early BSA.

