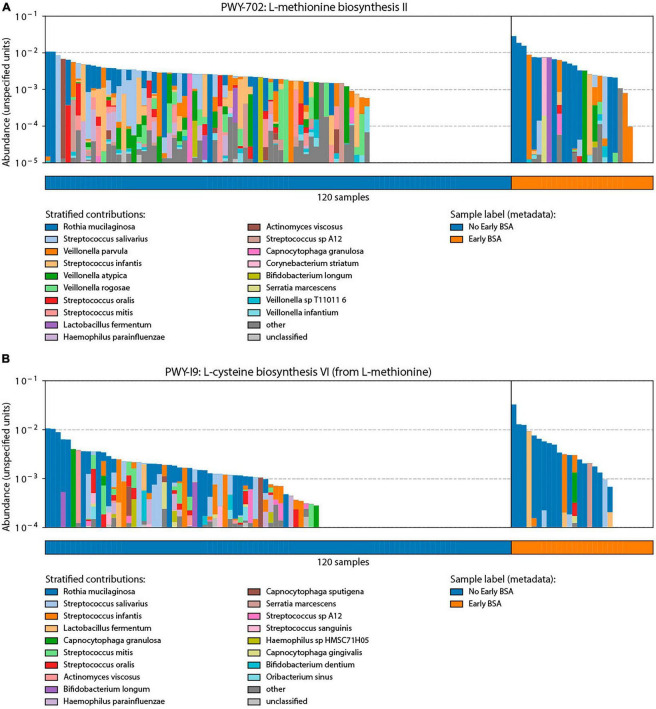
FIGURE 6.
Analysis of broad-spectrum sepsis antibiotic (BSA) classification by bacterial functional group. Significant pathways identified through bacterial functional analysis relative to BSA status with y-axis length or area of each colored segment showing the relative abundance of a taxonomic group in the given pathway: (A) L-methionine biosynthesis II pathway that was preferentially enriched in the Early BSA samples. (B) L-cysteine biosynthesis VI pathways were also enriched in the Early BSA samples.

