
FIGURE 3.
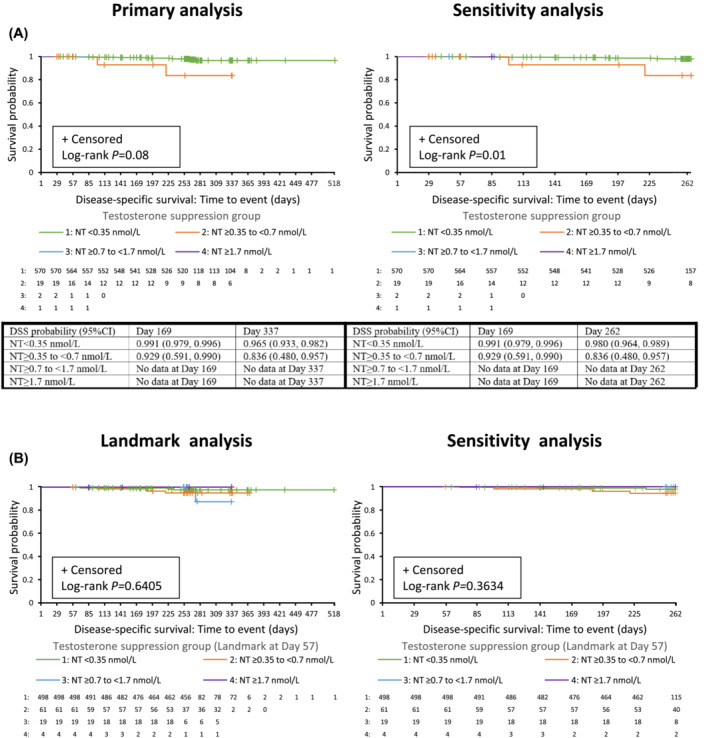
Kaplan–Meier plots of DSS by testosterone suppression group for (A) primary analysis and (B) landmark analysis, with landmark at Day 57. Number of subjects at risk and DSS probability estimates at Days 169 and 337 (Days 169 and 262 for sensitivity analysis) are shown underneath each graph. Data are shown for primary analysis and landmark analysis (time frame Days 1–518; left panel) and sensitivity analysis (time frame Days 1–262; right panel), with number of subjects at risk (intention‐to‐treat [ITT] analysis set). CI, confidence interval; DSS, disease‐specific survival; ITT, intention to treat; MT, maximum testosterone; NT, nadir testosterone.