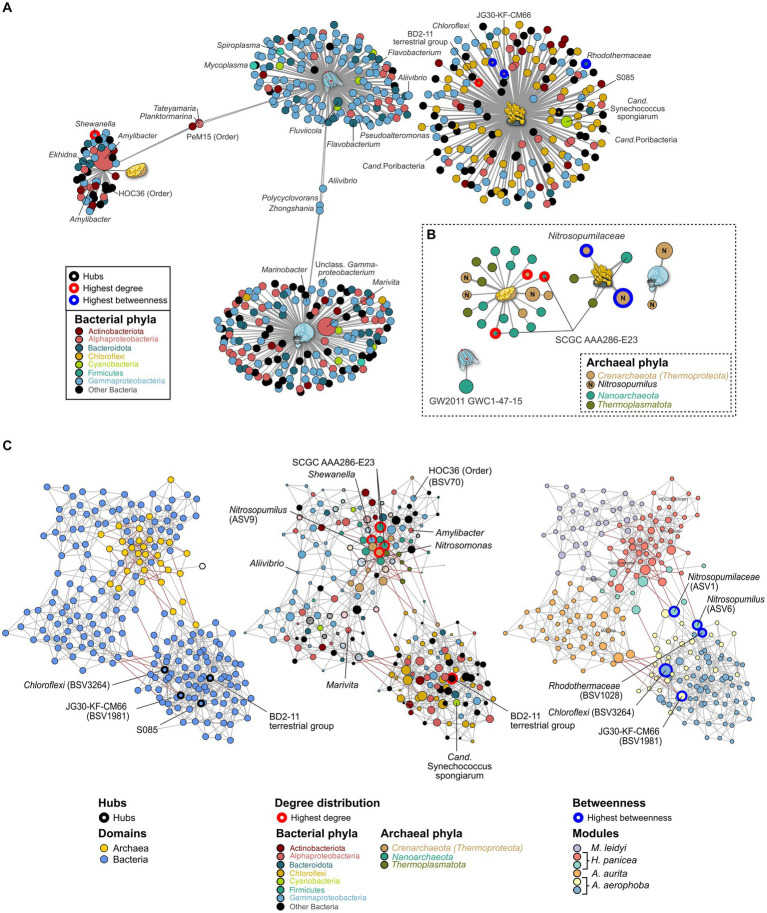
Figure 4.
Indicator (A,B) and association network analysis (C) on the bacterial and archaeal community in the marine hosts. (A) Bacterial and (B) archaeal indicators (>0.1%) for each host are colored by phylum. GTDB taxonomy is added where divergent from the SILVA database. Taxa with an abundance >1% are plotted by size relative to their average abundance in the dataset. Edge lengths indicate the association strength to the target, where larger distances are less strongly associated. (C) Association networks calculated using both the bacterial and archaeal communities and plotted using three different main aspects. Left: Network highlighting the bacterial (blue) and archaeal (yellow) domain. Middle: The same network but with node sizes adjusted to the number of degrees (connections) to other taxa. The most connected nodes are highlighted in red. Nodes are colored to reflect their phylum affiliation. All taxa which do not occur as indicator taxa are opaque. Right: Nodes are colored according to the six modules identified through NetCoMi analysis and correspond roughly to each host. Size of the bubbles is scaled according to their betweenness values. Nodes with the highest betweenness are highlighted by blue circles. Known symbionts, abundant taxa, and key species from the association networks are highlighted by name.

