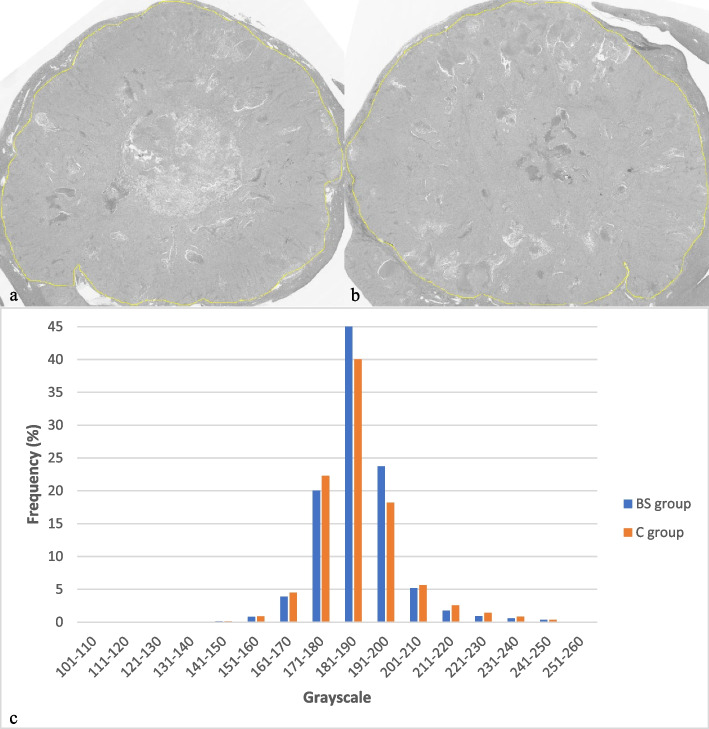
Fig. 2.
Grayscale images of two whole hematoxylin-eosin -stained slides and corresponding histograms of pixel distribution after treatment. a Grayscale image of a tumor in the bufalin plus sorafenib treatment group (histopathological standard deviation 10.475). b Grayscale image of a tumor in the control group (histopathological standard deviation 13.795). c Histograms of pixel distributions in the grayscale images of the tumors in the bufalin plus sorafenib treatment (blue) and control groups (orange)

