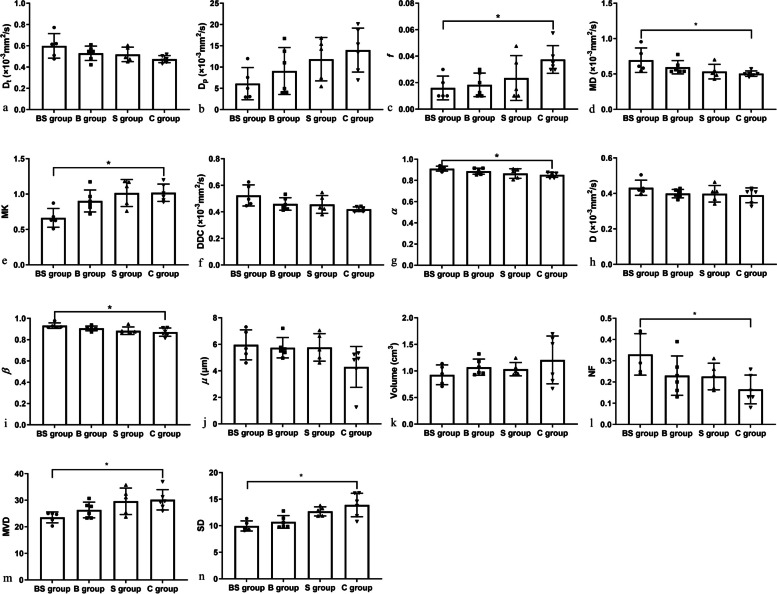
Fig. 3.
Comparisons of diffusion-weighted imaging and histopathological parameters of hepatocellular carcinoma LM3 models among the four groups. The results are expressed as the mean ± standard deviation (*p < 0.05). B Bufalin treatment, BS Bufalin plus sorafenib treatment, C Control, DDC Distributed diffusion coefficient, MD Mean diffusivity, MK Mean kurtosis, MVD Microvessel density, NF Necrotic fraction, S Sorafenib treatment, SD Histopathological standard deviation

