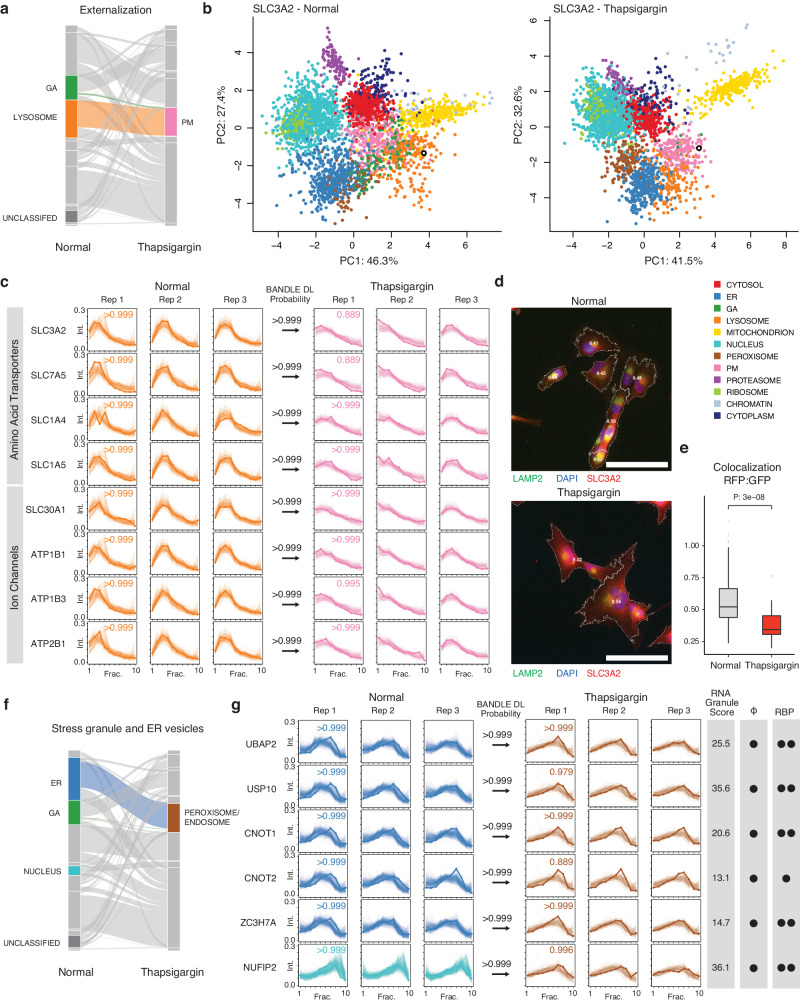
Fig. 3. SPLAT captures extensive protein localization changes under UPR.
a Alluvial plot of differential localization (DL) events (> 0.99 BANDLE DL probability; estimated FDR < 1%) following thapsigargin treatment showing a cohort of proteins moving from the Golgi apparatus (GA) and lysosome towards the plasma membrane (PM) (n = 3). b Spatial map for SLC3A2 (open black circle) in normal (left) and thapsigargin-treated (right) AC16 cells, showing its lysosomal assignment in normal cells and PM assignment in stressed cells. Colors: allocated subcellular compartment. c Ultracentrifugation fraction profile of SLC3A2 and other amino acid transporters SLC7A5, SLC1A4, SLC1A5 and ion channel proteins SLC30A1, ATP1B1, ATP1B3, and ATP2B1 with similar migration patterns. X-axis: fraction 1 to 10 of ultracentrifugation. Y-axis: relative channel abundance. Bold lines: protein of interest; light lines: ultracentrifugation profiles of all proteins classified to the compartment. Colors correspond to subcellular localization in panel b and all AC16 data in the manuscript; numbers within boxes: BANDLE allocation probability to compartment; numbers at arrows: BANDLE DL probability. d Immunofluorescence of SLC3A2 (red) against the lysosome marker LAMP2 (green) and DAPI (blue). Numbers in cell boundary: colocalization score per cell. Scale bar: 90 µm. e Colocalization score (Mander’s correlation coefficient) between SLC3A2 and LAMP2 decreases significantly (two-tailed unpaired t-test P value: 3e–8) in thapsigargin, consistent with movement away from lysosomal fraction (n = 205 normal cells, n = 32 thapsigargin treated cells). Center line: median; box limits: interquartile range; whiskers: 1.5x interquartile range; points: outliers. f Alluvial plot showing the migration of ER, GA, and nucleus proteins toward the peroxisome/endosome containing fraction in thapsigargin treated cells. g Ultracentrifugation fraction profile of stress granule proteins UBAP2, USP10, CNOT1, CNOT2, ZC3H7A, and NUFIP2. RNA Granule Score 7 or above is considered a known stress granule protein. Phi: predicted phase separation participation. Circle denotes a prediction of True within the database. RBP: Annotated RNA binding protein on the RNA Granule Database. One circle denotes known RBP in at least one data set; two circles denote known RBP in multiple datasets.

