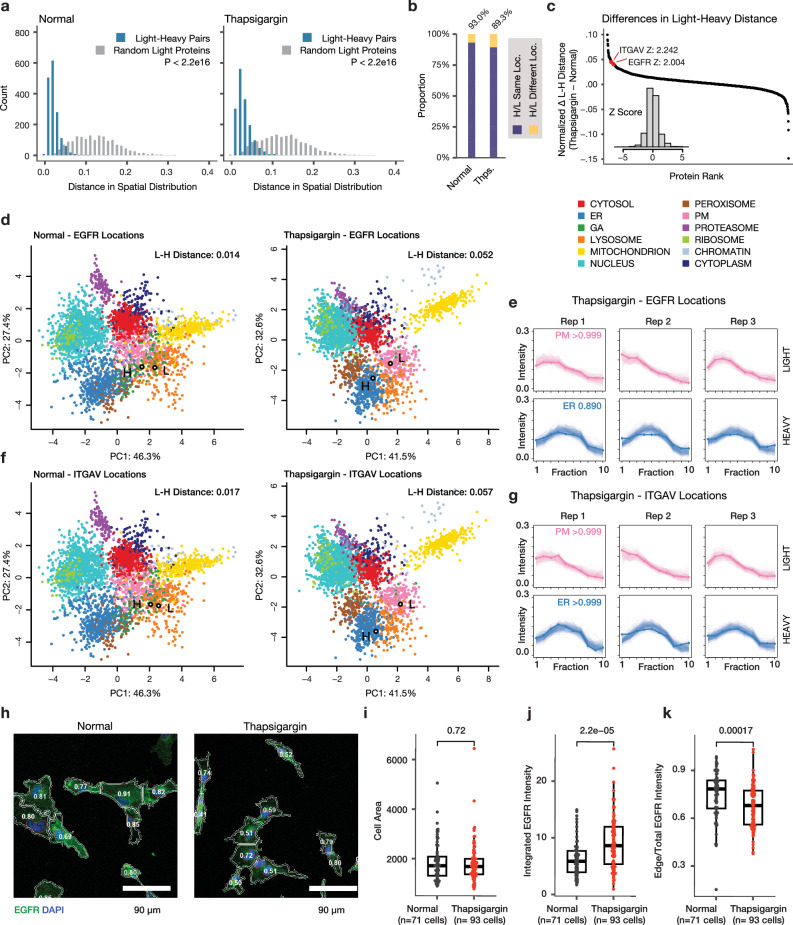
Fig. 4. SPLAT reveals protein-lifetime dependent differential localization.
a Histogram of distances in light and heavy proteins in normalized fraction abundance profiles in normal and thapsigargin-treated (Thps.) AC16 cells. X-axis: the spatial distribution distance of two proteins is measured as the average euclidean distance of all TMT channel relative abundance in the ultracentrifugation fraction profiles across 3 replicates; y-axis: count. Blue: distance for 1,614 quantified light-heavy protein pairs (e.g., unlabeled vs. SILAC-labeled EGFR). Grey: distribution of each corresponding light protein with another random light protein. P value: Mann–Whitney test (two-sided). b Proportion of heavy-light protein pairs with confidently assigned localization to the same location (purple) in normal (left; 93%) and thapsigargin (right; 89%) cells. c Ranked changes in heavy-light pair distance in thapsigargin treatment. The positions of EGFR and ITGAV are highlighted. Inset: Z score distribution of all changes. d Spatial map of the light and heavy EGFR in normal and thapsigargin-treated cells. Each data point is a light or heavy protein species. Color: assigned compartment. Numbers: euclidean distance in fraction profiles over 3 replicates. e Corresponding fraction profiles; x-axis: ultracentrifugation fraction; y-axis: fractional abundance. Post-labeling synthesized EGFR is differentially distributed in thapsigargin and shows ER retention (blue), whereas the preexisting EGFR pool remains to show a likely cell surface localization (pink) after thapsigargin. f, g As above, for ITGAV. h Confocal imaging of EGFR immunofluorescence supports a partial relocalization of EGFR from the cell surface toward internal membranes following thapsigargin. Numbers: ratio of EGFR at the plasma membrane vs. whole cells. Blue: DAPI; green: EGFR; scale bar: 90 µm. i Cell areas; Mann-Whitney two-sided P: 0.72. Center line: median; box limits: interquartile range; whiskers: 1.5x interquartile range. j Total EGFR intensity per cell; Mann-Whitney two-sided P: 2.2e-05. Center line: median; box limits: interquartile range; whiskers: 1.5x interquartile range. k Edge/total intensity ratios in normal and thapsigargin-treated AC16 cells (n = 71 normal cells; n = 93 thapsigargin cells; Mann–Whitney two-sided P: 1.7e–4). Center line: median; box limits: interquartile range; whiskers: 1.5x interquartile range.

