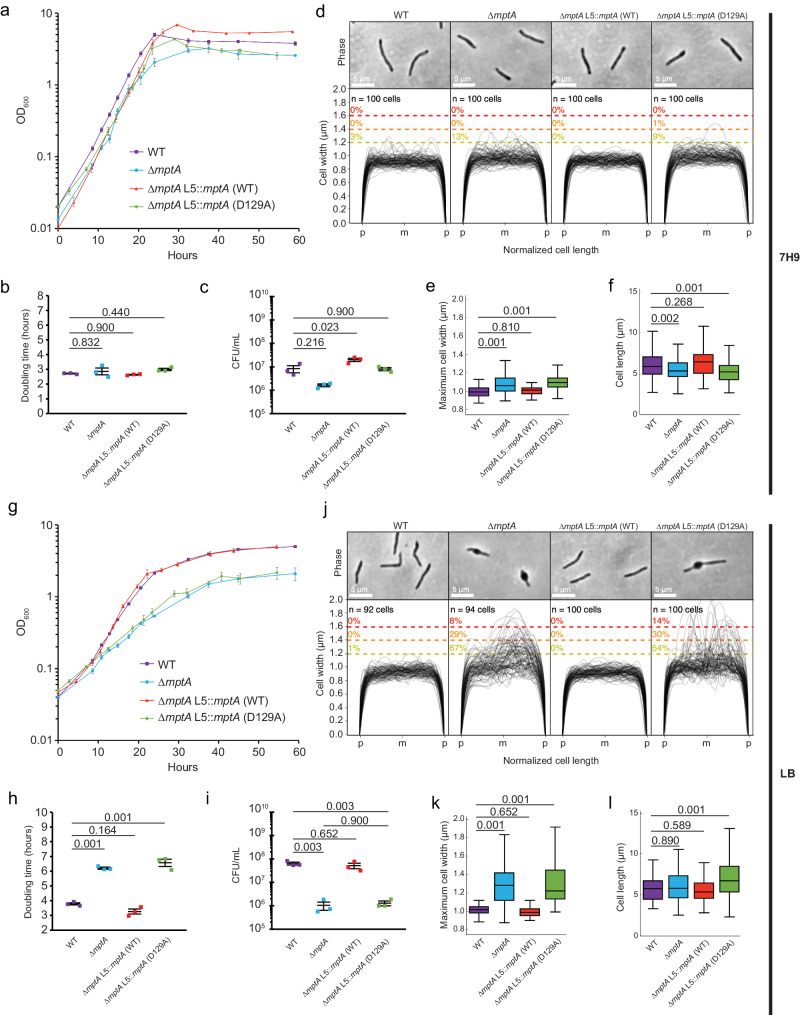
Fig. 2. Growth and cell morphology of planktonically growing cells.
a, g Growth curves of WT, ∆mptA, ∆mptA L5::mptA (WT), and ∆mptA L5::mptA (D129A) cells grown planktonically in Middlebrook 7H9 (a) or LB (g) medium. OD600, optical density at 600 nm. Error bars represent the standard error of the mean of three biological replicates. b, h Doubling times, determined from optical density growth curves, of WT, ∆mptA, ∆mptA L5::mptA (WT), and ∆mptA L5::mptA (D129A) cells in 7H9 (b) or LB (h) during log-phase growth. The middle line indicates the mean of three biological replicates (indicated with colored squares). The bottom and top lines represent the standard error of the mean. c, i CFU/mL of WT, ∆mptA, ∆mptA L5::mptA (WT), and ∆mptA L5::mptA (D129A) cells in 7H9 (c) or LB (i) at the 24-h timepoint. The middle line indicates the mean of 3 biological replicates (indicated with colored squares). The bottom and top lines represent the standard error of the mean. d, j Phase contrast micrographs and cell width profiles of planktonic WT, ∆mptA, ∆mptA L5::mptA (WT), and ∆mptA L5::mptA (D129A) cells grown in 7H9 (d) and LB (j). Each cell’s length was normalized to the same length with “p” and “m” indicating cell poles and mid-cell, respectively. The percentage values above the dotted colored lines indicate the portion of cells exhibiting maximum cell widths greater than or equal to the corresponding cell width threshold. e, k Boxplots comparing the distribution of maximum cell widths between WT, ∆mptA, ∆mptA L5::mptA (WT), and ∆mptA L5::mptA (D129A) strains grown planktonically in 7H9 (e) or LB (k). n = 100 cells for each strain in panel (e) and n = 92, 94, 100, 100 cells for WT, ∆mptA, ∆mptA L5::mptA (WT), and ∆mptA L5::mptA (D129A), respectively in panel (k). f, l Boxplots comparing the distribution of cell lengths between WT, ∆mptA, ∆mptA L5::mptA (WT), and ∆mptA L5::mptA (D129A) strains grown planktonically in 7H9 (f) or LB (l). The boxplots are drawn as described in Fig. 1. Statistical significance for each experiment was determined by one-way ANOVA and Tukey post-hoc test. n = 174, 162, 111, 136 cells for WT, ∆mptA, ∆mptA L5::mptA (WT), and ∆mptA L5::mptA (D129A) respectively in panel (f). n = 92, 94, 121, 158 cells for WT, ∆mptA, ∆mptA L5::mptA (WT), and ∆mptA L5::mptA (D129A), respectively in panel (l). Source data for each sub-panel are provided in the Source Data file. Microscopy image data for panels d–f, j–l are available at https://github.com/IanLairdSparks/Sparks_2023.

