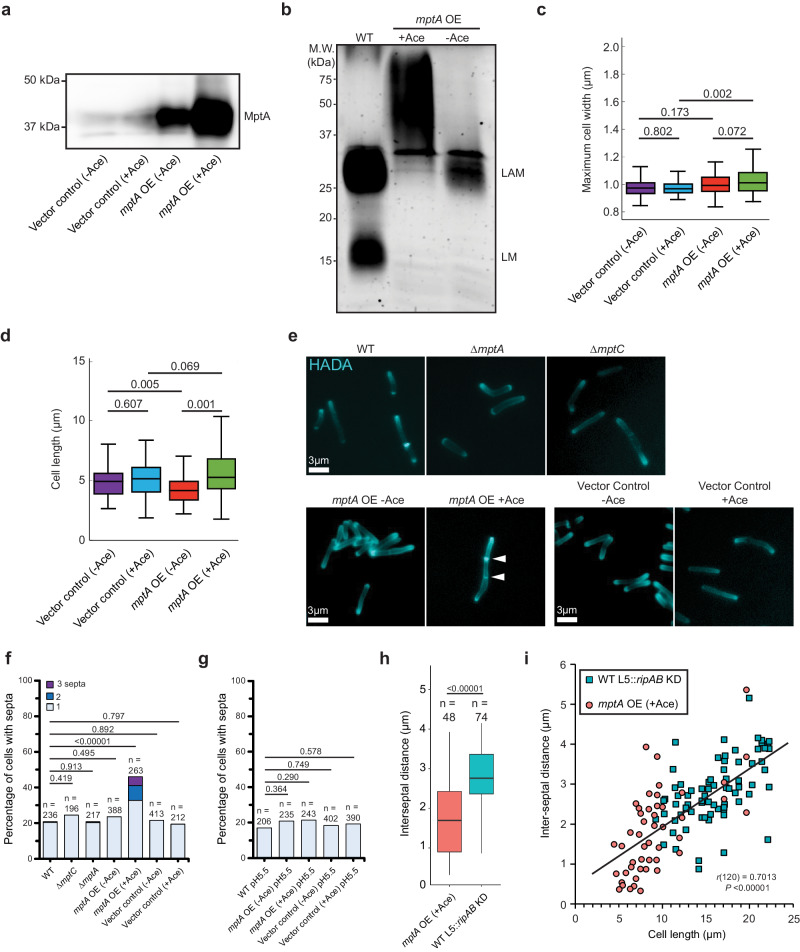
Fig. 5. Large LAM biosynthesis results in multiseptated cells.
a Anti-MptA immunoblot of cell lysates prepared from mptA OE (-/+ acetamide), and vector control (-/+ acetamide) cells. Equal protein amount was loaded per lane. Ace, acetamide. Blot is representative of two independent experiments with similar results. b SDS-PAGE of lipoglycans extracted from WT, and the mptA OE strain with and without acetamide, visualized by glycan staining. Gel is representative of two independent experiments with similar results. c, d Boxplots comparing the distribution of maximum cell widths (c) and cell lengths (d) of mptA OE (-/+ acetamide), and vector control (-/+ acetamide) strains. n = 100, 100, 100, 100 (panel c) and 103, 105, 161, 118 cells (panel d) for vector control - acetamide, vector control + acetamide, mptA OE - acetamide, and mptA OE + acetamide, respectively. The boxplots are drawn as described in Fig. 1. Statistical significance was determined by one-way ANOVA and Tukey post-hoc test. e Fluorescence micrographs of HADA-labeled cells. f Septa enumeration for WT and lipoglycan mutant cells grown planktonically in LB. The combined bar height indicates the total percentage of cells with one or more septa. Statistical significance was determined by one-sided chi-square tests, with total non-septated and total septated cell counts as the two categorical variables compared between strains. g Septa enumeration for WT, mptA OE (-/+ acetamide), and vector control (-/+ acetamide) strains grown planktonically in acidic (pH 5.5) LB medium. Statistical significance was determined as described in panel (f). h Comparison between the distribution of septum-to-septum distances observed in multiseptated acetamide-induced mptA OE cells and multiseptated WT L5::ripAB KD cells. n values represent the total number of septum-to-septum distances measured in multiseptated cells of each strain. mptA overexpression and ripAB knockdown were both induced for 8 h. The boxplots are drawn as described in Fig. 1. Statistical significance was determined using the one-tailed student’s T-test. P = 1.41 × 10⁻⁸. i Correlation of cell lengths to inter-septal distances, comparing multiseptated acetamide-induced mptA OE cells (red circle) and multiseptated WT L5::ripAB KD cells (blue square). Pearson correlation analysis was conducted to determine the strength of correlation (agnostic to genetic background); septum-to-septum distance and cell length were found to be moderately positively correlated, r(120) = 0.70, P = 2.36 × 10⁻¹⁹. Statistical significance was determined using the two-tailed student’s T-test. Source data for panels a–d and f–i are provided in the Source Data file. Microscopy image data for panels c–i are available at https://github.com/IanLairdSparks/Sparks_2023.

