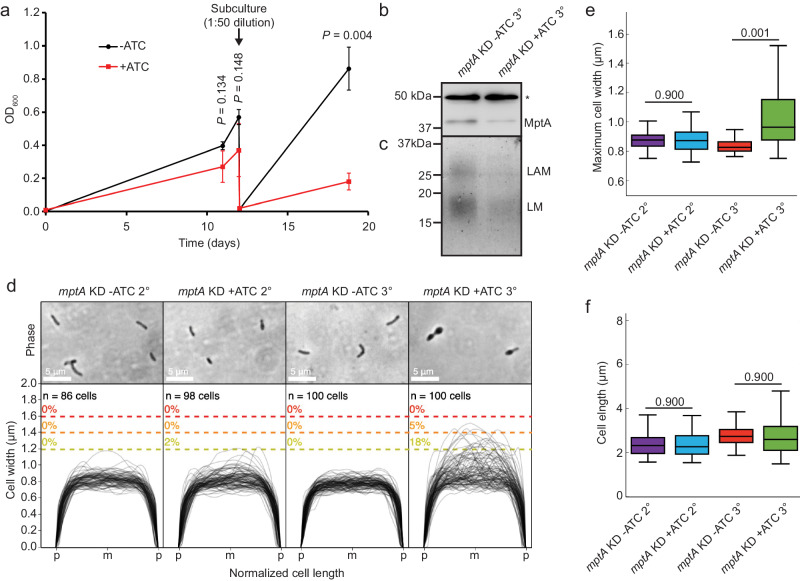
Fig. 6. CRISPRi knockdown of mptA induces morphological and growth defects in M. tuberculosis.
a Growth delay of M. tuberculosis mptA KD induced with ATC (red square) compared to the uninduced condition (black circle), measured using optical density at 600 nm. The cells were sub-cultured twice with continuous exposure to 100 ng/mL ATC. The first sub-culture (2° culture) was sub-cultured into fresh medium (1:50 dilution) on day 12 (arrow) and incubated for an additional seven days (3° culture). Averages of biological triplicates with error bars representing standard errors of the mean are shown. Statistical significance of growth differences between -ATC and +ATC conditions were determined using the one-tailed student’s T-test. b Anti-MptA immunoblot of M. tuberculosis cell lysates prepared from mptA KD (-/ + ATC) at the end of the second subcultures (3°). *, a non-specific protein, showing equal loading of two samples. Blot is representative of two independent experiments with similar results. c SDS-PAGE of lipoglycans extracted from M. tuberculosis mptA KD second subcultures (3°) with and without ATC, visualized by glycan staining. Gel is representative of two independent experiments with similar results. d Phase contrast micrographs and cell width profiles for M. tuberculosis mptA KD at the end of the first (2°) and second (3°) sub-cultures with and without ATC. Cell width profiles were graphed as described in Fig. 2. “p” and “m” indicate cell poles and mid-cell, respectively. e, f Boxplots comparing the distribution of maximum cell widths (e) and cell lengths (f) between M. tuberculosis mptA KD at the end of the first (2°) and second (3°) sub-cultures with and without ATC. The boxplots are drawn as described in Fig. 1. Statistical significance was determined by one-way ANOVA and Tukey post-hoc test. n = 86, 98, 100, 100 cells for mptA KD - ATC 2°, mptA KD + ATC 2°, mptA KD - ATC 3°, mptA KD + ATC 3°, respectively, in panel e. n = 86, 98, 102, 165 cells for mptA KD - ATC 2°, mptA KD + ATC 2°, mptA KD - ATC 3°, mptA KD + ATC 3°, respectively, in panel f. Source data for each sub-panel are provided in the Source Data file. Microscopy image data for panels d–f are available at https://github.com/IanLairdSparks/Sparks_2023.

