Figure 3.
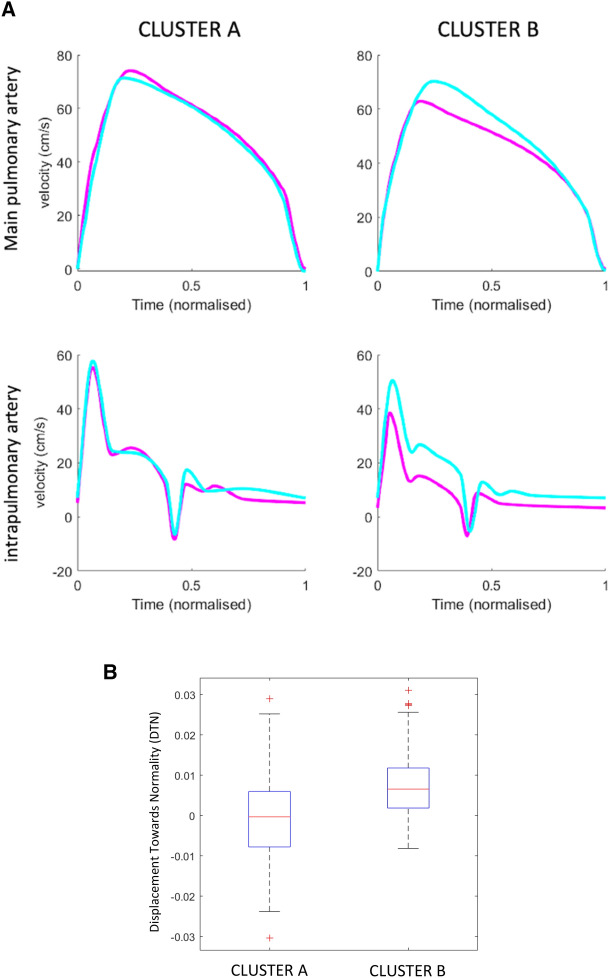
Machine learning analysis of changes in fetal lung Doppler waveforms in the study population identifying two different clusters. (A) Main and intrapulmonary Doppler traces from a representative individual in each cluster in baseline conditions and after maternal hyperoxygenation. Representative main pulmonary (top) and intrapulmonary (bottom) curves of each cluster in baseline conditions (violet) and after maternal hyperoxygenation (turquoise blue). Doppler traces from fetuses included in cluster A hardly change after maternal hyperoxygenation, while pulmonary Doppler traces significantly change after maternal hyperoxygenation in cluster B. Of note, after maternal hyperoxygenation fetuses in cluster B show a significant increase in peak velocity and delayed time-to-peak in the main pulmonary artery (top right panel) with also a significant increase in peak velocities of the intrapulmonary artery (bottom right). (B) Median and interquartile range values of displacement towards normality (DTN) distribution in the two identified clusters using MKL. Red lines indicate median values, boxes indicate interquartile range and whiskers extend from first and third quartiles to the most extreme values. Median DTN in cluster A is near 0, while DTN in cluster B is significantly higher (p-value <0.0001).

