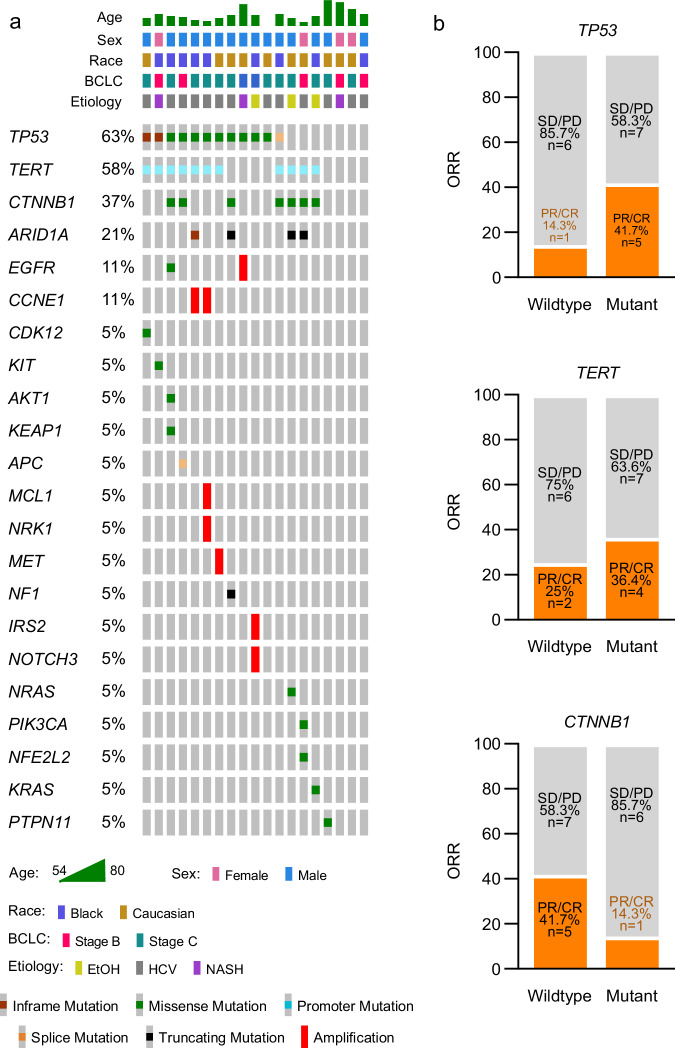
Fig. 2. Genomic profiling of evaluable patients treated with bavituximab plus pembrolizumab.
a Oncoprint plot depicts the landscape and distribution of genomic alterations among evaluable patients (n = 19) who underwent clinical sequencing. Barcelona clinic liver cancer, BCLC. b Stacked bar graphs depict proportion of patients with objective tumor responses (PR or CR) among patients with TERT promoter, TP53, or CTNNB1 alterations. ORR objective response rate, PR partial response, CR complete response, SD stable disease, PD progressive disease. Fisher’s exact tests were used to assess associations between tumor response and molecular. Source data are provided as a Source data file.

