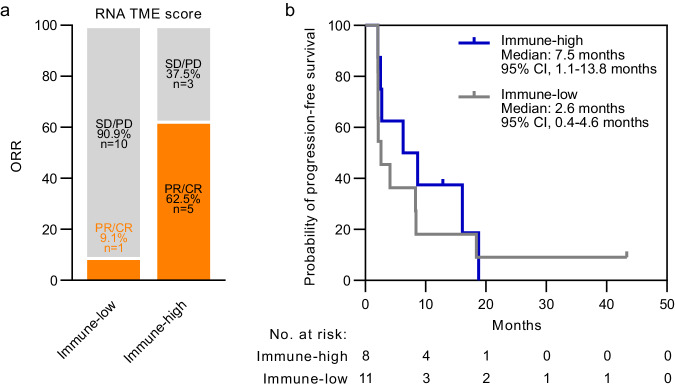
Fig. 4. Exploratory analysis of a RNA-based TME assay.
a Tumors were classified into as immune-low or immune-high based on the Xerna TME Panel. Stacked bar graph depicts ORR of each patient subset (two-sided Fisher’s exact test p = 0.0408). ORR objective response rate, PR partial response, CR complete response, SD stable disease, PD progressive disease. b Kaplan-Meier curve shows the probability of progression-free survival over time among evaluable patients differentiated by Xerna TME biomarker status. Source data are provided as a Source data file.

